Census Peculiarities in Incarcerated Populations
There were zero people residing at Ray Brook Federal Correctional Institution on April 1st, 2020 according to the most recent U.S. Census. However, the New York State Department of Corrections and Community Supervision (DOCCS) counted prisoners at the facility on the same day.
Reviewing the redistricting processes of some states revealed discrepancies between the incarcerated population counts of states’ departments of corrections (DOC) and the U.S. Census Bureau.
In 11 states— California, Colorado, Connecticut, Delaware, Maryland, Nevada, New Jersey, New York, Pennsylvania, Virginia, and Washington— demographers reallocated incarcerated populations according to state law or by decision by the redistricting committee for the 2020 redistricting cycle. The demographers used lists of names and addresses provided from the state’s department of corrections to reallocate populations of incarcerated individuals from the census blocks of incarceration facilities to the census blocks of last known addresses before incarceration to avoid prison gerrymandering.
When demographers attempted to reallocate individuals by subtracting incarcerated populations from the census block where the incarceration facility is located, demographers often discovered the census population count to be lower than that of the department of corrections’ list of names. In some cases, demographers found populations of zero.
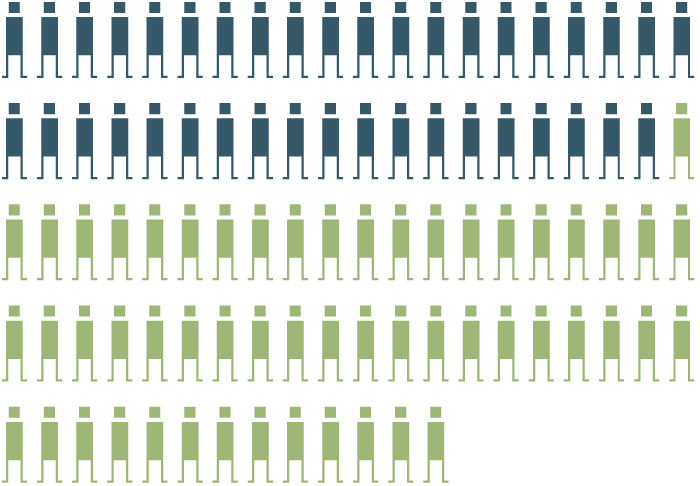
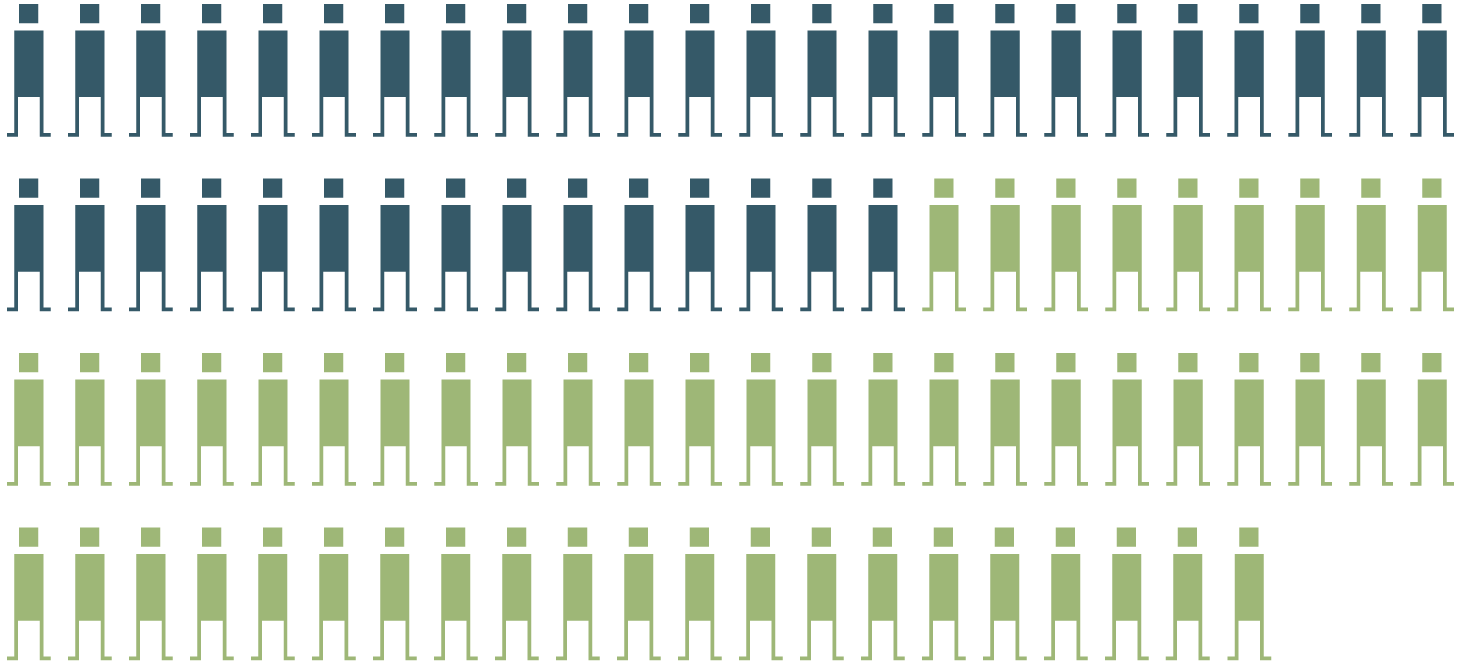
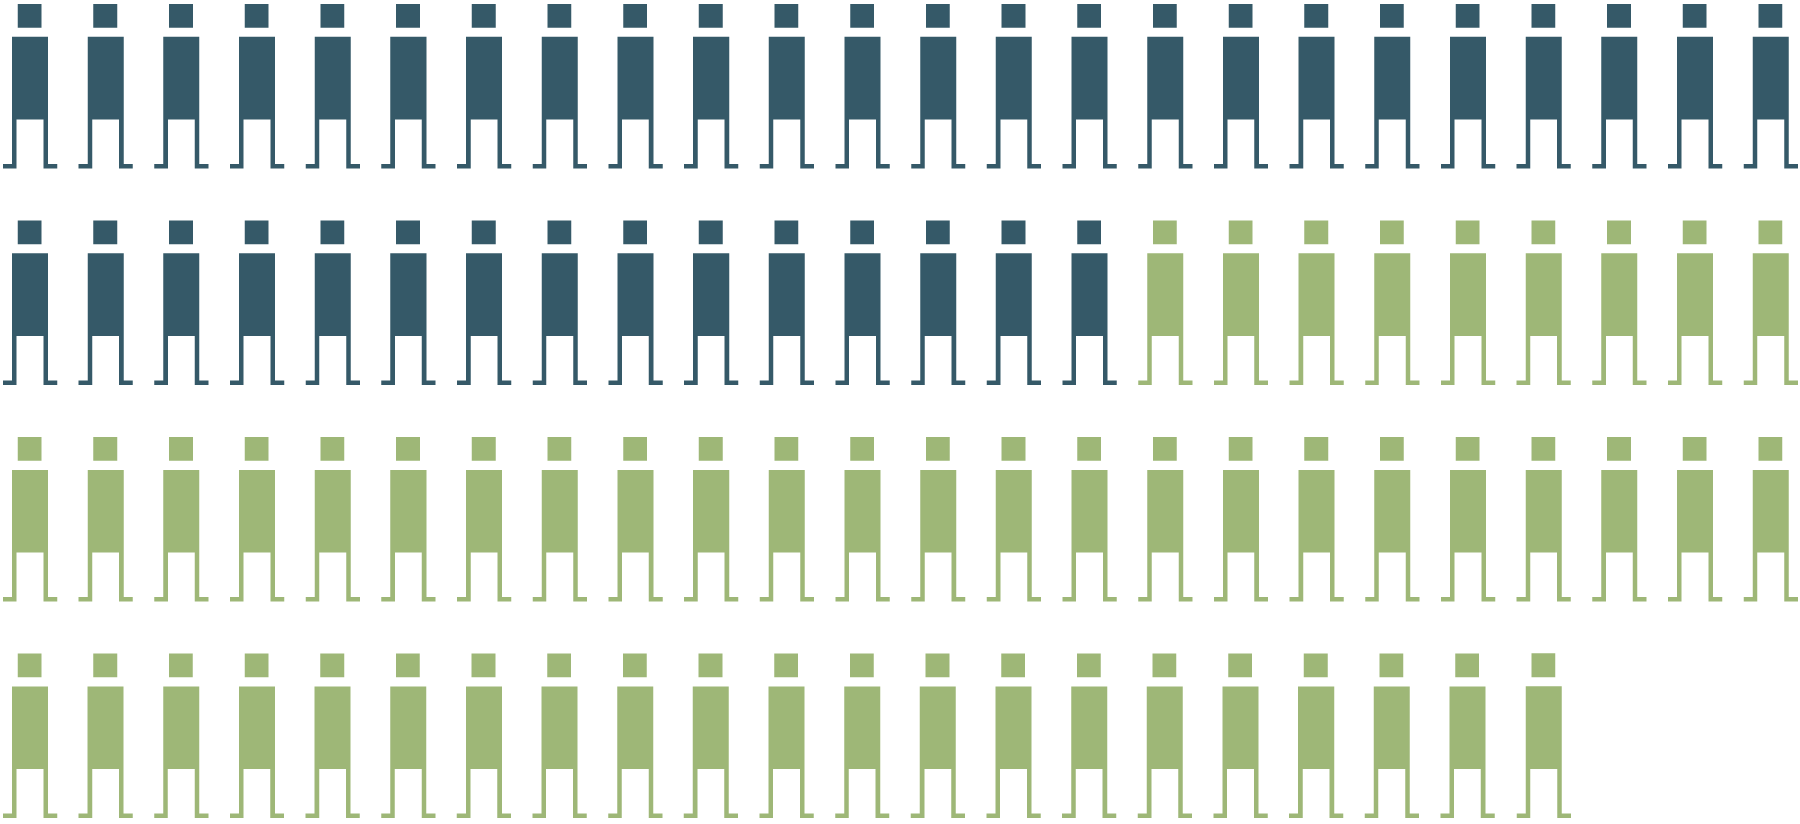
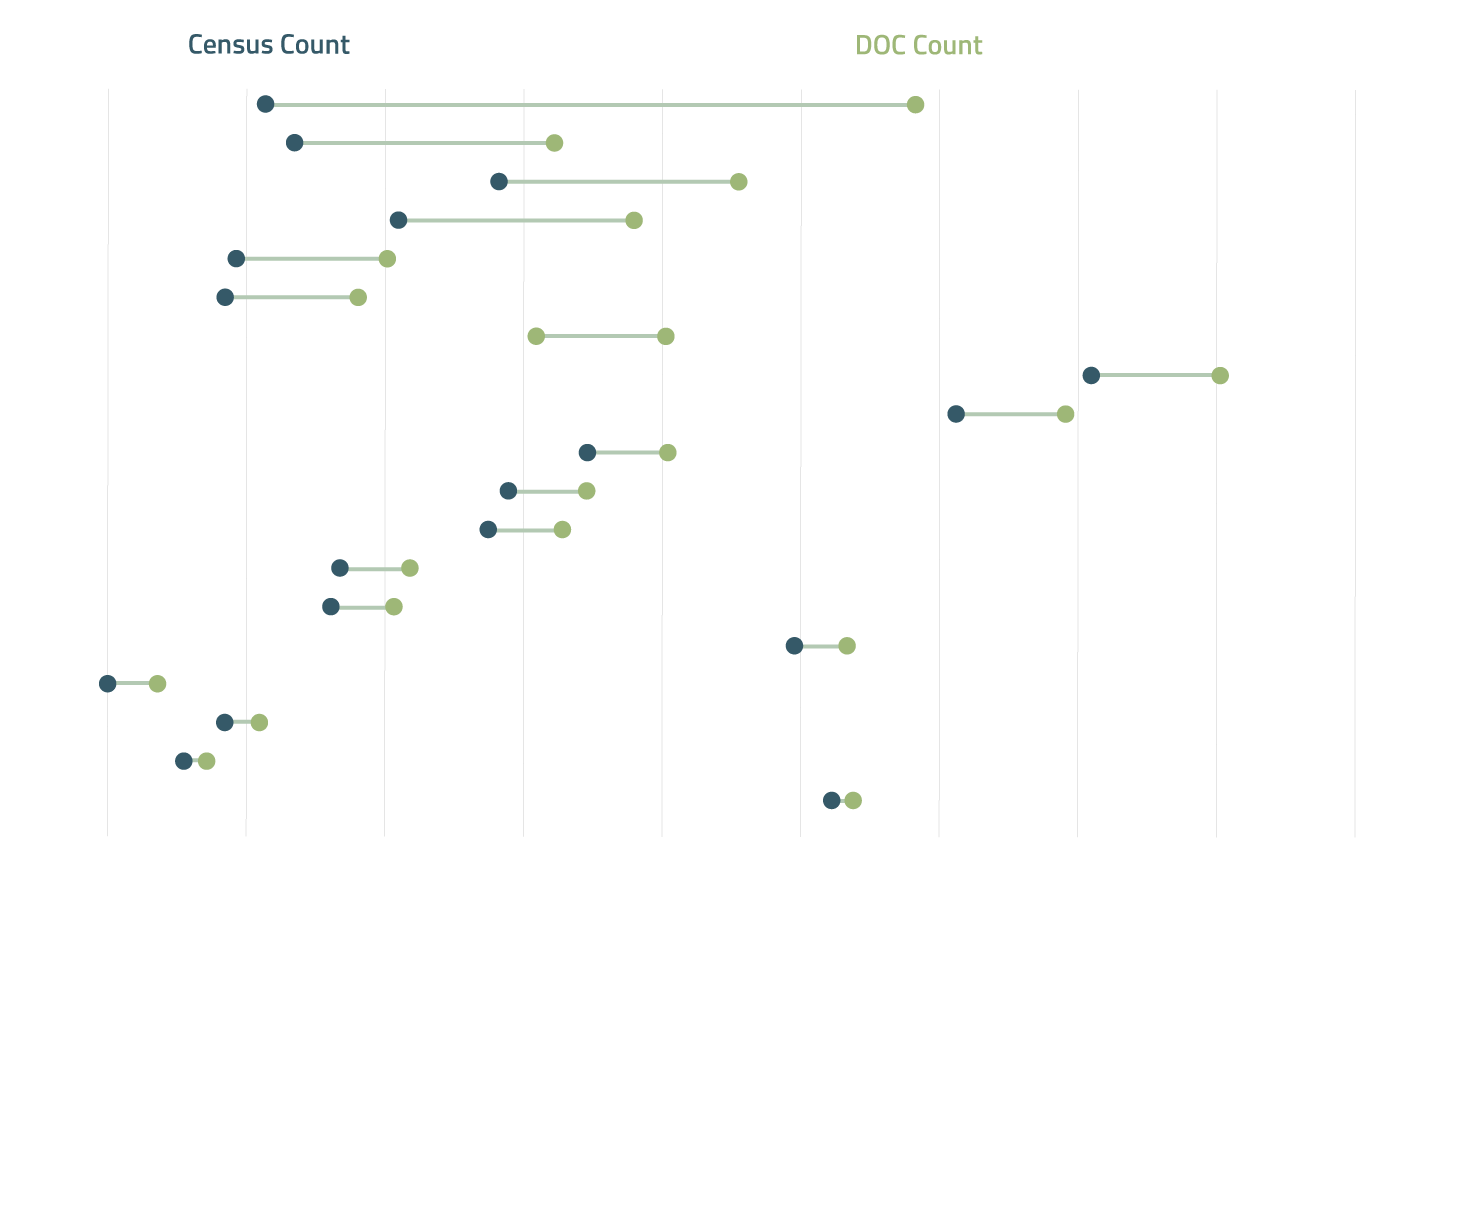
In an analysis of three states’ incarcerated population counts— Delaware, Colorado, and New York— the DOC count exceeded the Census count in nearly 60 percent of all the census blocks with incarceration facilities. This gap in numbers totals to over 4,000 people across the three states. Given census blocks also can include people living near an incarceration facility, it would seemingly be more likely for the Census to have a higher count than that of the DOC for a given location, making the difference in counts all the more puzzling. Note: these three states were chosen to analyze because of the states' availibility of data. There is some indication that this occurred in other states as well, but comparable data wasn't available.
DOC Count exceeded Census Count in 54 out of 93 Census Blocks
Comparing incarcerated population counts of the U.S. Census and states’ department of corrections across Delaware, Colorado, New York
Source: U.S. Census 2020 PL 94-171, Redistricting Data Hub, Colorado Independent Redistricting Commissions, NYS LATFOR
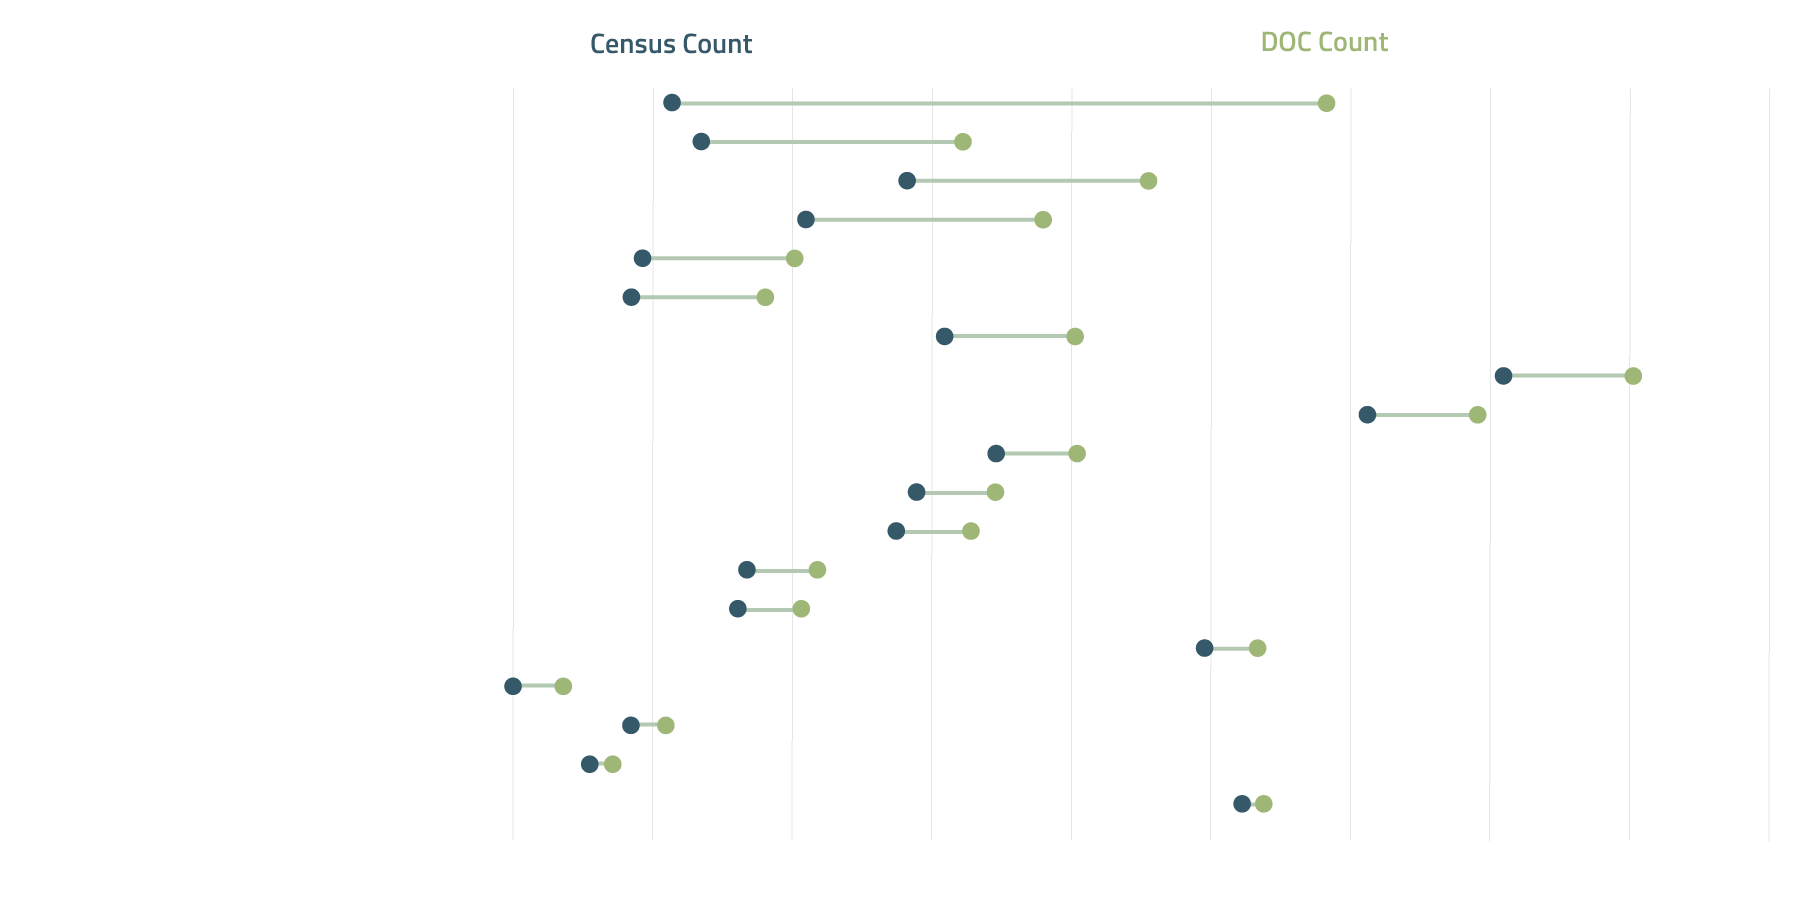
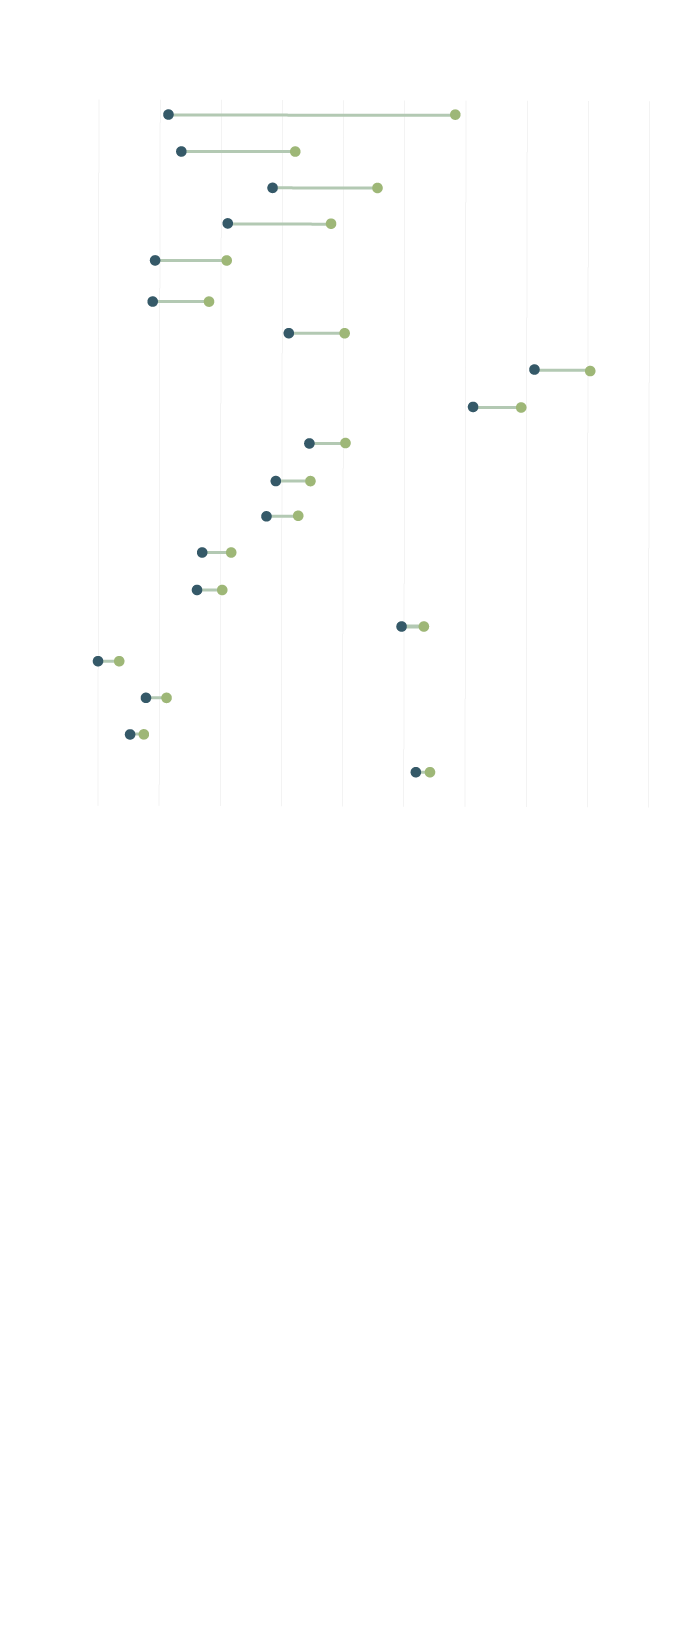
In roughly 20 percent of the blocks with incarceration facilities, the DOC counted at least 30 people more than the Census. The most extreme example was the census block including Wyoming Correctional Facility, where the Census counted 227 people and New York DOCCS counted 1,165 incarcerated individuals, a difference of over 400 percent.
The Census counted fewer incarcerated people than the DOC in some areas
The Department of Corrections (DOC) count exceeded the Census count by more than 30 people in 19 out of the 93 Census blocks with incarceration facilities across Delaware, Colorado, and New York
DOC Count
Census Count
|
|
+938
Wyoming Correctional Facility
+375
Bedford Hills Correctional Facility
+346
Colorado Territorial Correctional Facility
+340
Albion Correctional Facility
+218
Centennial Correctional Facility
+192
Ogdensburg Correctional Facility
+187
Midstate Correctional Facility
+186
Fremont Correctional Facility
+158
Bent County Correctional Facility
+116
Cayuga Correctional Facility
+113
Riverview Correctional Facility
+107
La Vista Correctional Facility
+101
Midstate Correctional Facility
+91
Hale Creek Correctional Facility
+76
Five Points Correctional Facility
+72
Hazel D. Plant Women's Treatment Facility
+50
San Carlos Correctional Facility
+33
Midstate Correctional Facility
+31
Marcy Correctional Facility
0
200
400
600
800
1000
1200
1400
1600
1800
Census Count
DOC Count
|
|
1
+938
+375
2
3
+346
+340
4
+218
5
+192
6
7
+187
8
+186
9
+158
10
+116
+113
11
+107
12
+101
13
+91
14
15
+76
+72
16
+50
17
+33
18
19
+31
0
200
400
600
800
1000
1200
1400
1600
1800
3 Colorado Territorial Correctional Facility
2 Bedford Hills Correctional Facility
1 Wyoming Correctional Facility
6 Ogdensburg Correctional Facility
5 Centennial Correctional Facility
4 Albion Correctional Facility
7 Midstate Correctional Facility
9 Bent County Correctional Facility
8 Fremont Correctional Facility
10 Cayuga Correctional Facility
11 Riverview Correctional Facility
13 Midstate Correctional Facility
12 La Vista Correctional Facility
16 Hazel D. Plant Women's Treatment Facility
15 Five Points Correctional Facility
14 Hale Creek Correctional Facility
17 San Carlos Correctional Facility
18 Midstate Correctional Facility
19 Marcy Correctional Facility
Census Count
DOC Count
|
|
1
+938
2
+375
3
+346
4
+340
+218
5
6
+192
7
+187
8
+186
9
+158
10
+116
11
+113
12
+107
13
+101
14
+91
15
+76
+72
16
+50
17
+33
18
19
+31
0
200
400
600
800
1000
1200
1400
1600
1800
1 Wyoming Correctional Facility
2 Bedford Hills Correctional Facility
3 Colorado Territorial Correctional Facility
4 Albion Correctional Facility
5 Centennial Correctional Facility
6 Ogdensburg Correctional Facility
7 Midstate Correctional Facility
8 Fremont Correctional Facility
9 Bent County Correctional Facility
10 Cayuga Correctional Facility
11 Riverview Correctional Facility
12 La Vista Correctional Facility
13 Midstate Correctional Facility
14 Hale Creek Correctional Facility
15 Five Points Correctional Facility
16 Hazel D. Plant Women's Treatment Facility
17 San Carlos Correctional Facility
18 Midstate Correctional Facility
19 Marcy Correctional Facility
Source: U.S. Census 2020 PL 94-171, Redistricting Data Hub, Colorado Independent Redistricting Commissions, NYS LATFOR
States’ Documentation
Many states, where re-allocation processes occurred, recorded peculiarities in their process documentation— each state highlighting different challenges and unique inconsistencies.
New Jersey’s documentation revealed seven census blocks with population counts of zero where facilities can be found.
Seven Census Blocks were counted as zero populations by the Census Bureau
Excerpt from New Jersey’s Reallocated Redistricting Data Report
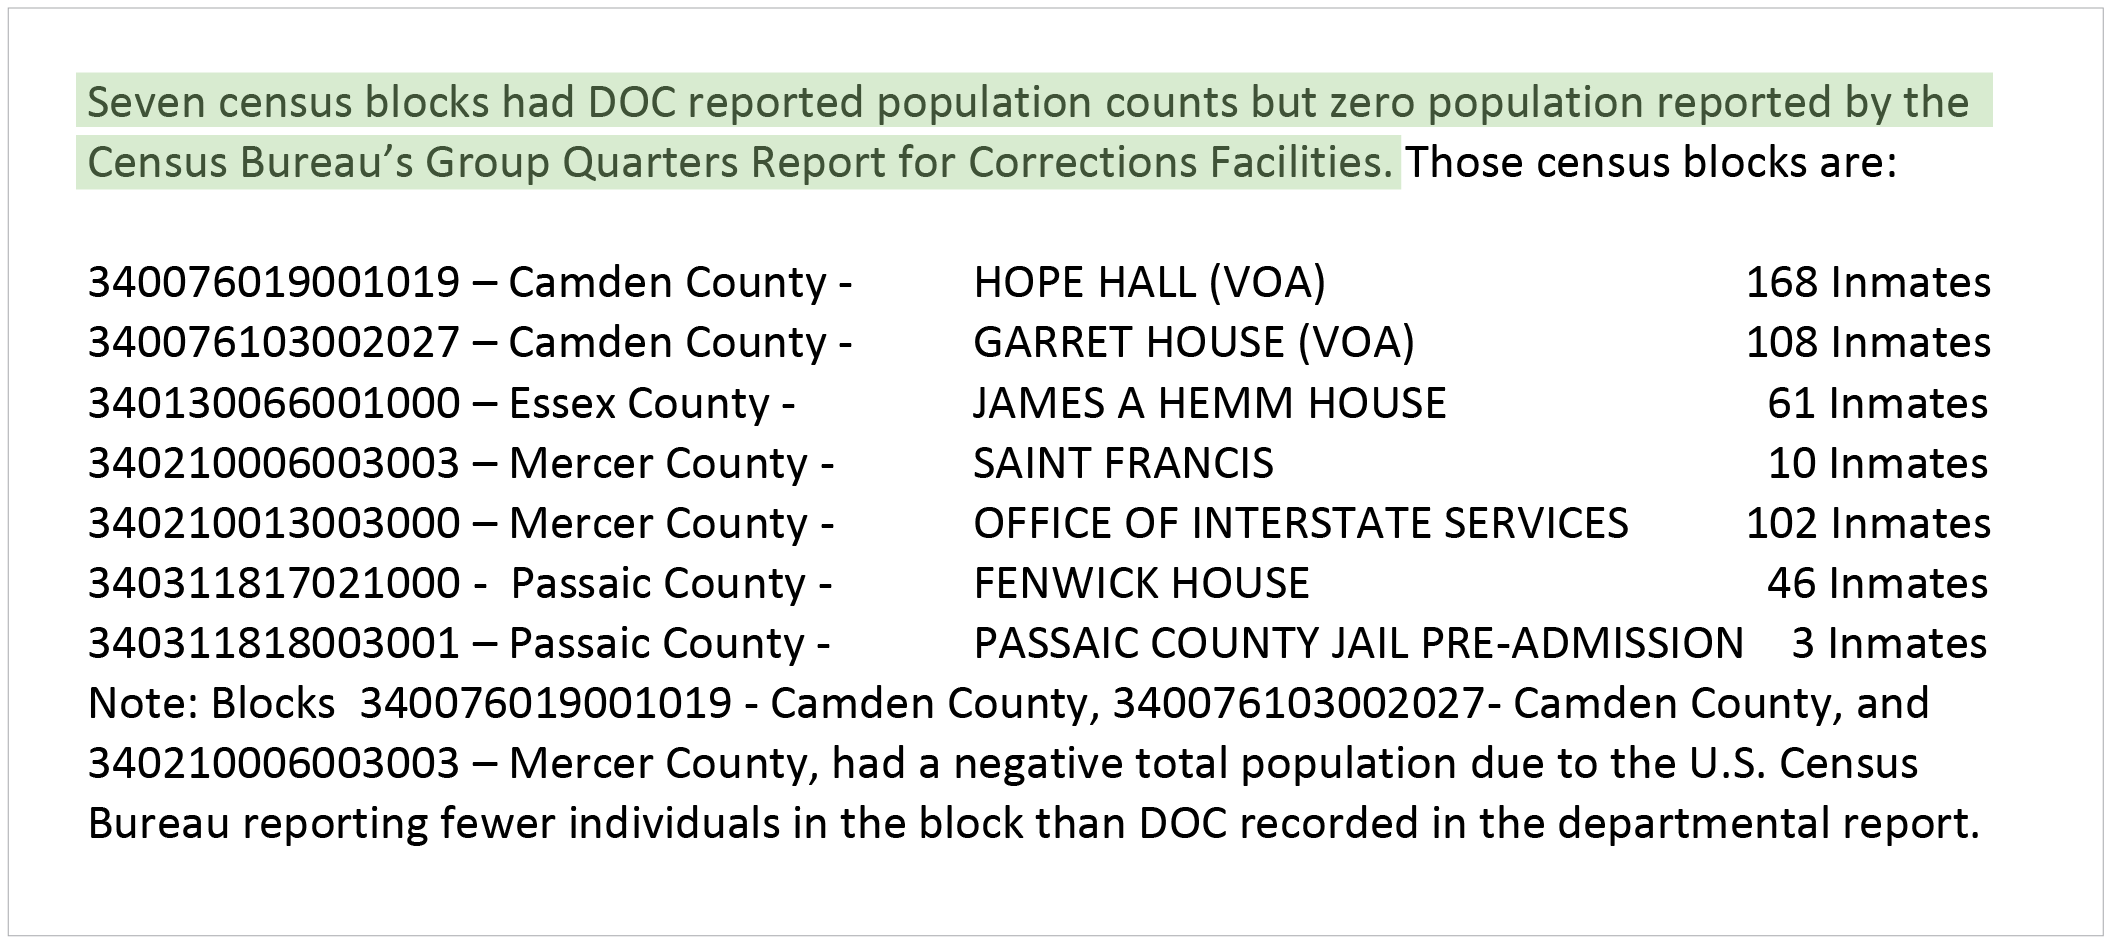
Source: NJ Department of State — Report Explaining the U.S. Census Bureau 2020 Census Pub L. 94-171 Redistricting Data and New Jersey P.L.2019, c.385 Reallocated Redistricting Data, p. 8
The documentation from the New York State Legislative Task Force on Demographic Research and Reapportionments indicated demographers first subtracted populations from facilities and then added to prior addresses, recording the adjusted populations of each census block before maps could be drawn. In a number of census blocks, negative populations were reported as subtracting more persons listed in DOC’s count from the lower census count yielded negative figures.
On the subject of Ray Brook Correctional’s zero population, the task force wrote, “without additional guidance or population input from the Census Bureau, the Task Force technical staff are unable to subtract any people from that facility.”
One concerned resident in Virginia, a professor Charles Kromkowski submitted a public comment to Virginia’s Redistricting Committee highlighting 21 census blocks with negative populations in the state. “Unlike a typographical mistake, an error like this typically indicates a systemic data-processing problem,” he wrote. “If left uncorrected, this datafile will undermine the Court’s effort to comply with the U.S. and Virginia constitutional expectation for election district population equality.”
Virginia resident highlighted 21 Census Blocks with negative populations to Supreme Court of Virginia
Email from Charles A. Kromkowski, Professor of Politics at UVa
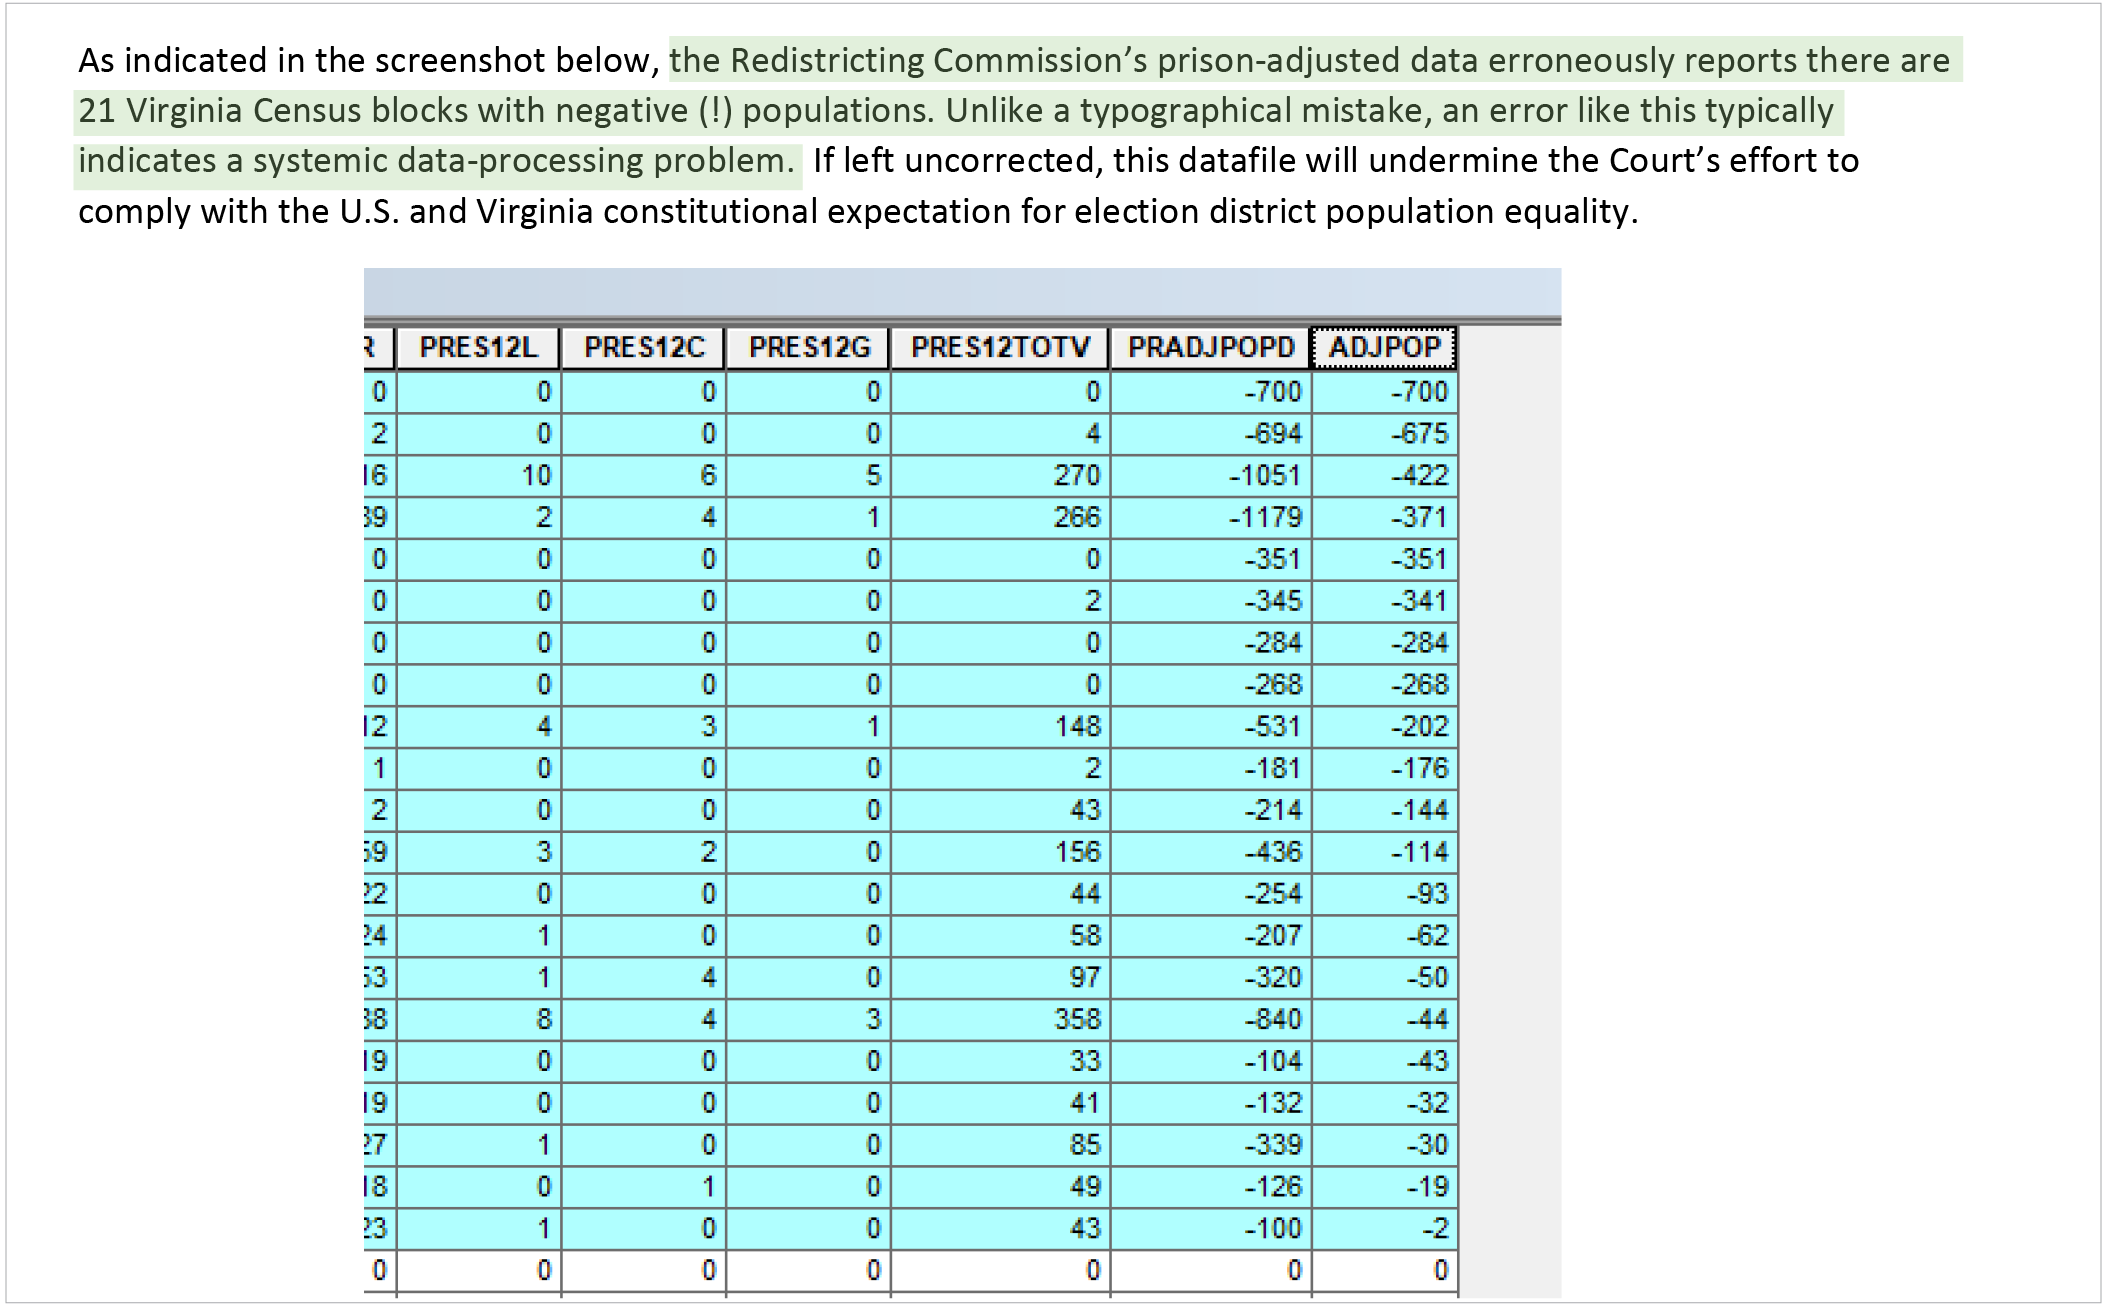
Source: Supreme Court of Virginia — Redistricting Information, Email in Public Comments p. 1767-1773
Washington state GIS analysts listed potential reasons for the negative populations in their Adjusted Redistricting Data, Readme file. “The facility data could be temporally out of sync with the Census,” the notes suggested. Other potential reasons included the challenge of facilities being assigned to more than one census block and the inclusion of “Differential Privacy” into the 2020 Count. Also the file simply includes, “the Census data could be incorrect. There could have been counting errors.”
Washington state provided potential reasons for inconsistencies in data
Excerpt from Washington State Adjusted Redistricting Data, Readme
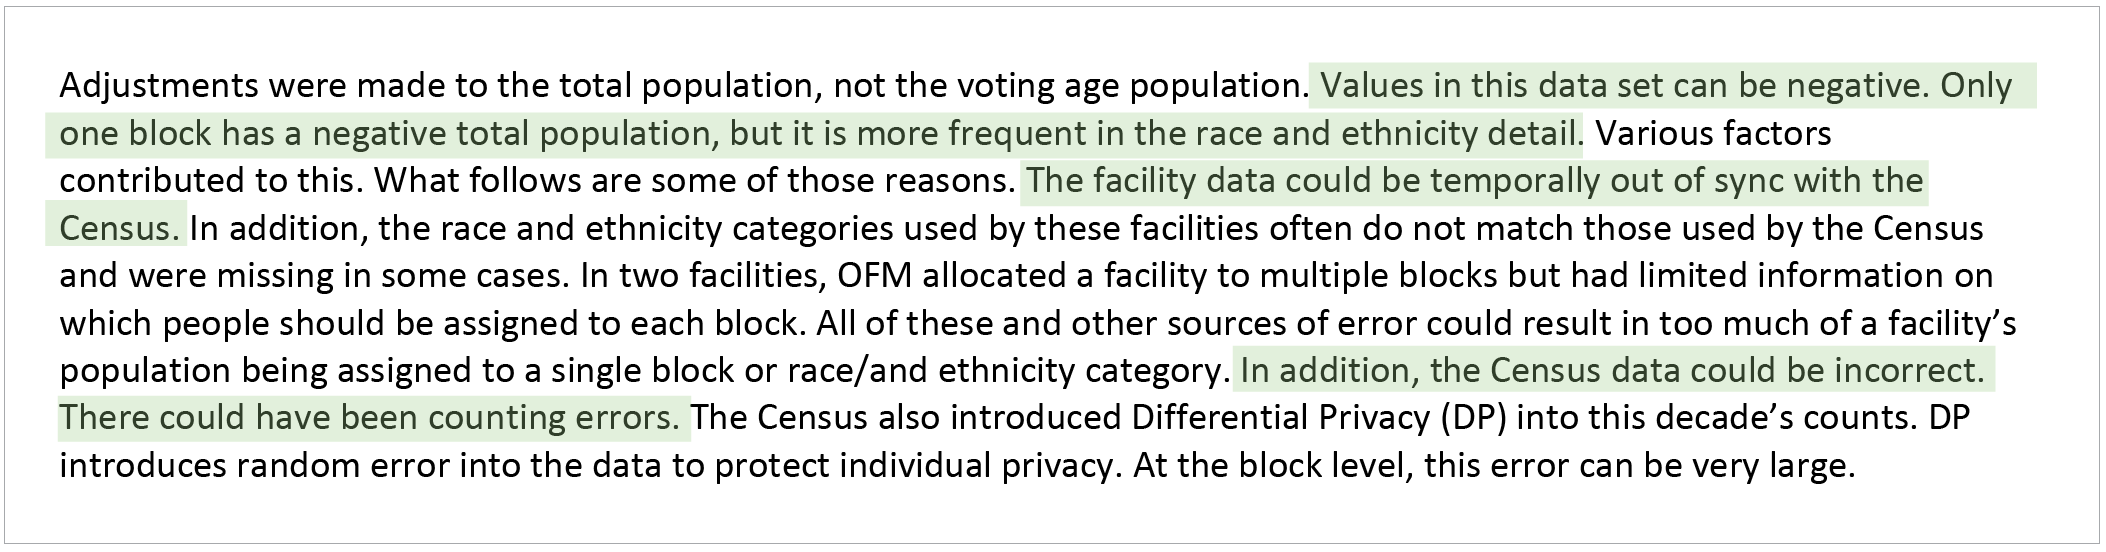
Source: Washington Office of Financial Management, Data & Research — Washington State Adjusted Redistricting Data, Readme, p. 1
Census Processes
In general, the U.S. Census Bureau monitors the accuracy of the census with the Post-Enumeration Surveys, which check the accuracy of the census in sample blocks. Although, incarcerated populations do not seem to be put through the same rigor.
The Bureau recently shared its results of the 2020 Post-Enumeration Survey, though the survey universe did not include group quarters of which incarcerated populations are considered. This follows past actions by the Bureau, which did not include group quarters in surveys in 2000 nor in 2010.
"We will not be releasing estimates, undercounts or overcounts for correctional facilities," said Timothy Kennel, the assistant division chief of the Statistical Methods branch at the U.S. Census Bureau. "We don't have measures for that at the Census Bureau, so this would be from other sources outside the Census Bureau."Bureau process included step for collecting missing data
U.S. Census Bureau Process for Self-Enumeration
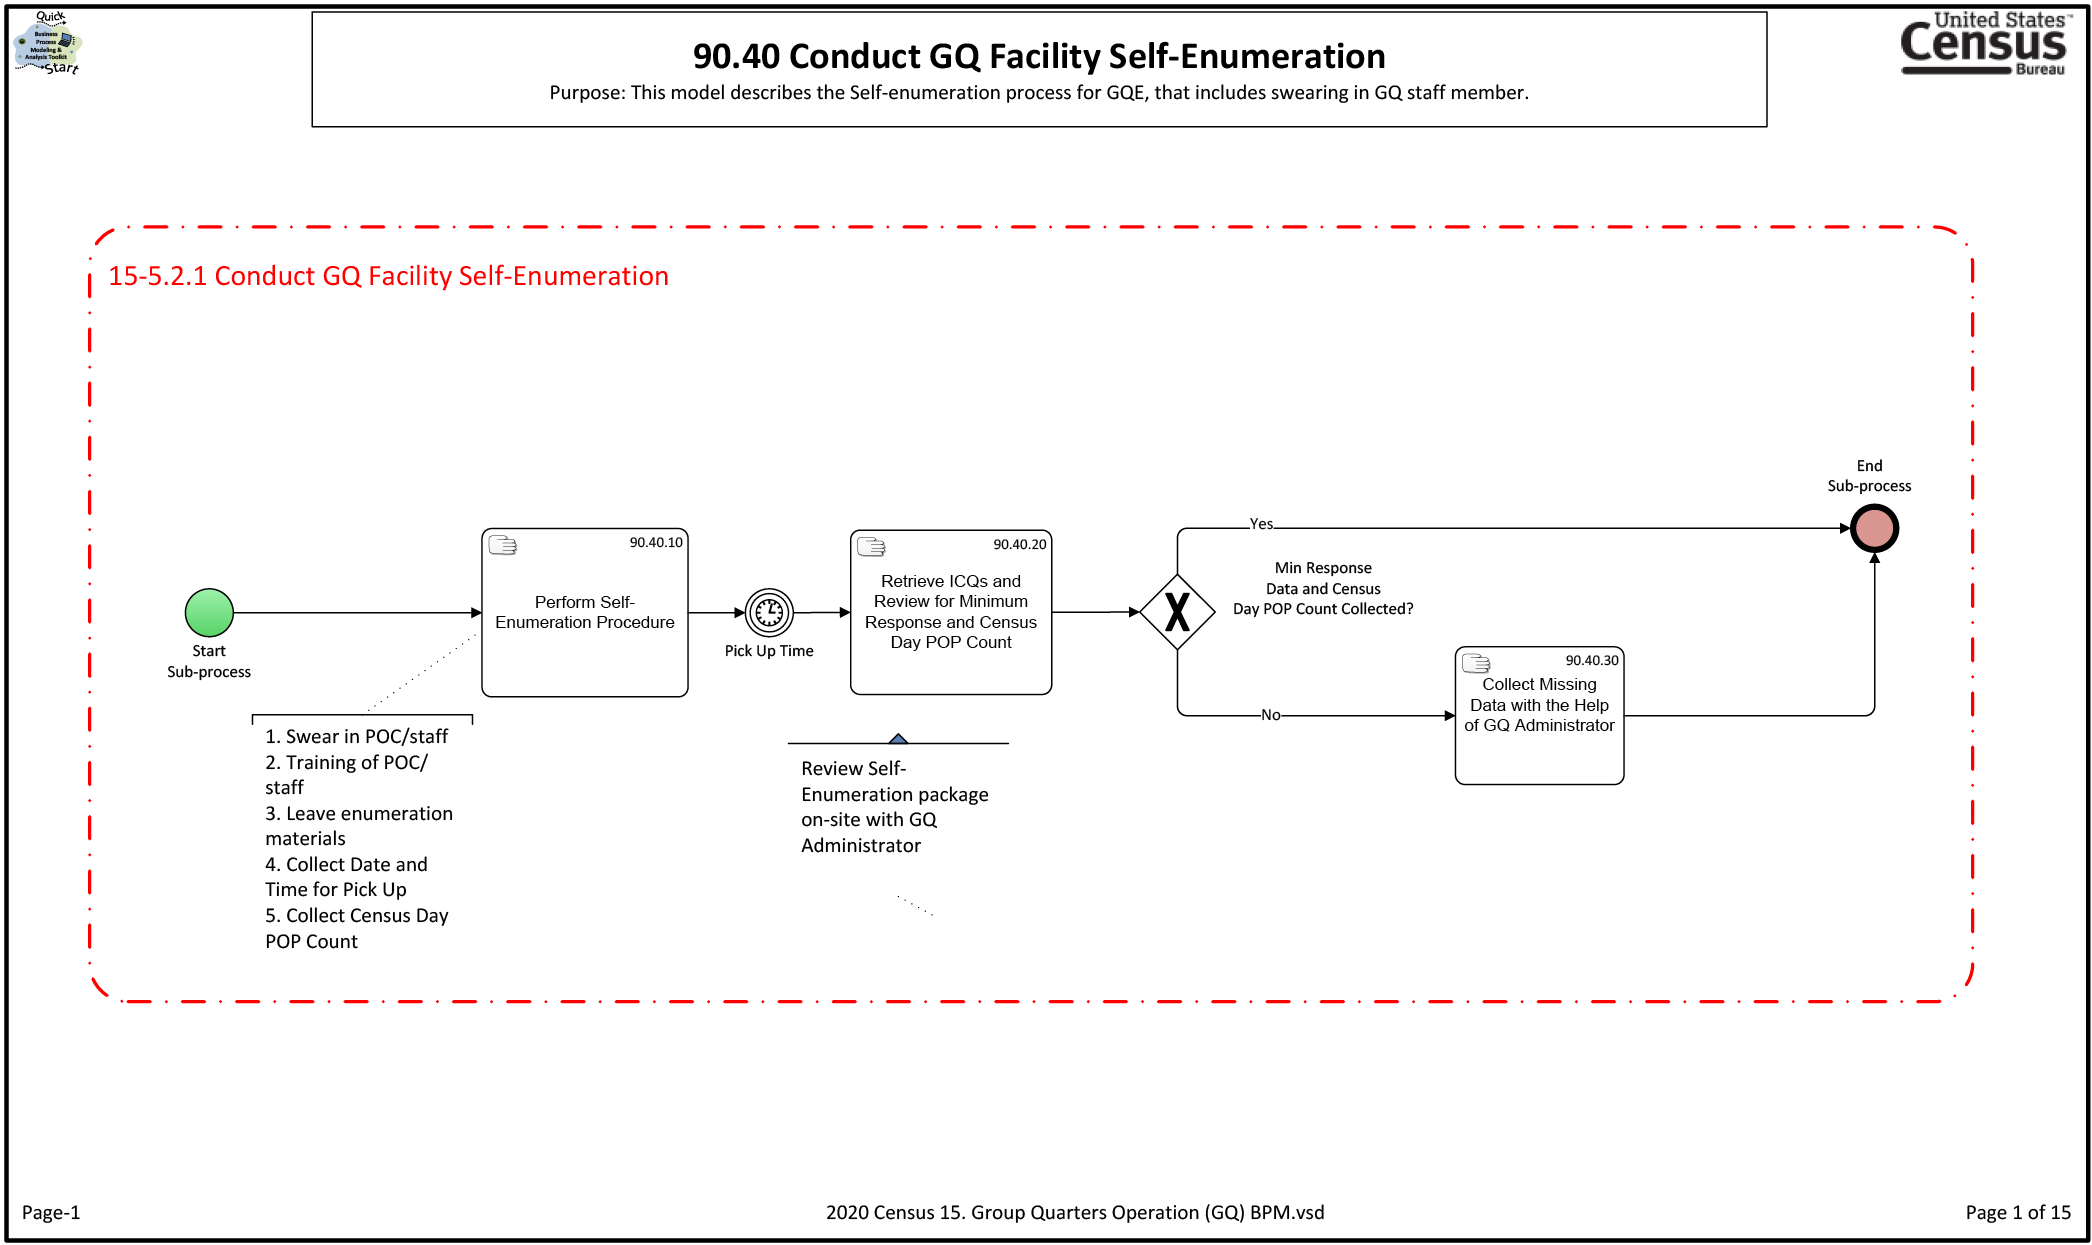
Source: United States Census Bureau — 2020 Census Detailed Operational Plan for Group Quarters (GQ), p. 56
The Census Bureau gathered its 2020 data about incarcerated facilities from a number of methods. Most often, the Bureau counted incarcerated populations by self-enumeration, or the swearing in of a DOC officer as a census enumerator, the person taking the census; other methods employed required e-response or paper submissions.
The process for self-enumeration included a step to “Collect Missing Data with the Help of GQ [Group Quarters] Administrator.”