Investigating Inequalities of Essex County
This ongoing project uses graphic exploration and some statistical analysis to consider factors influencing educational attainment in nearby schools of Essex County, Massachusetts. Much of the data comes from the National Center for Education Statistics (NCES), the U.S. Census, and the most recent American Community Survey (ACS).
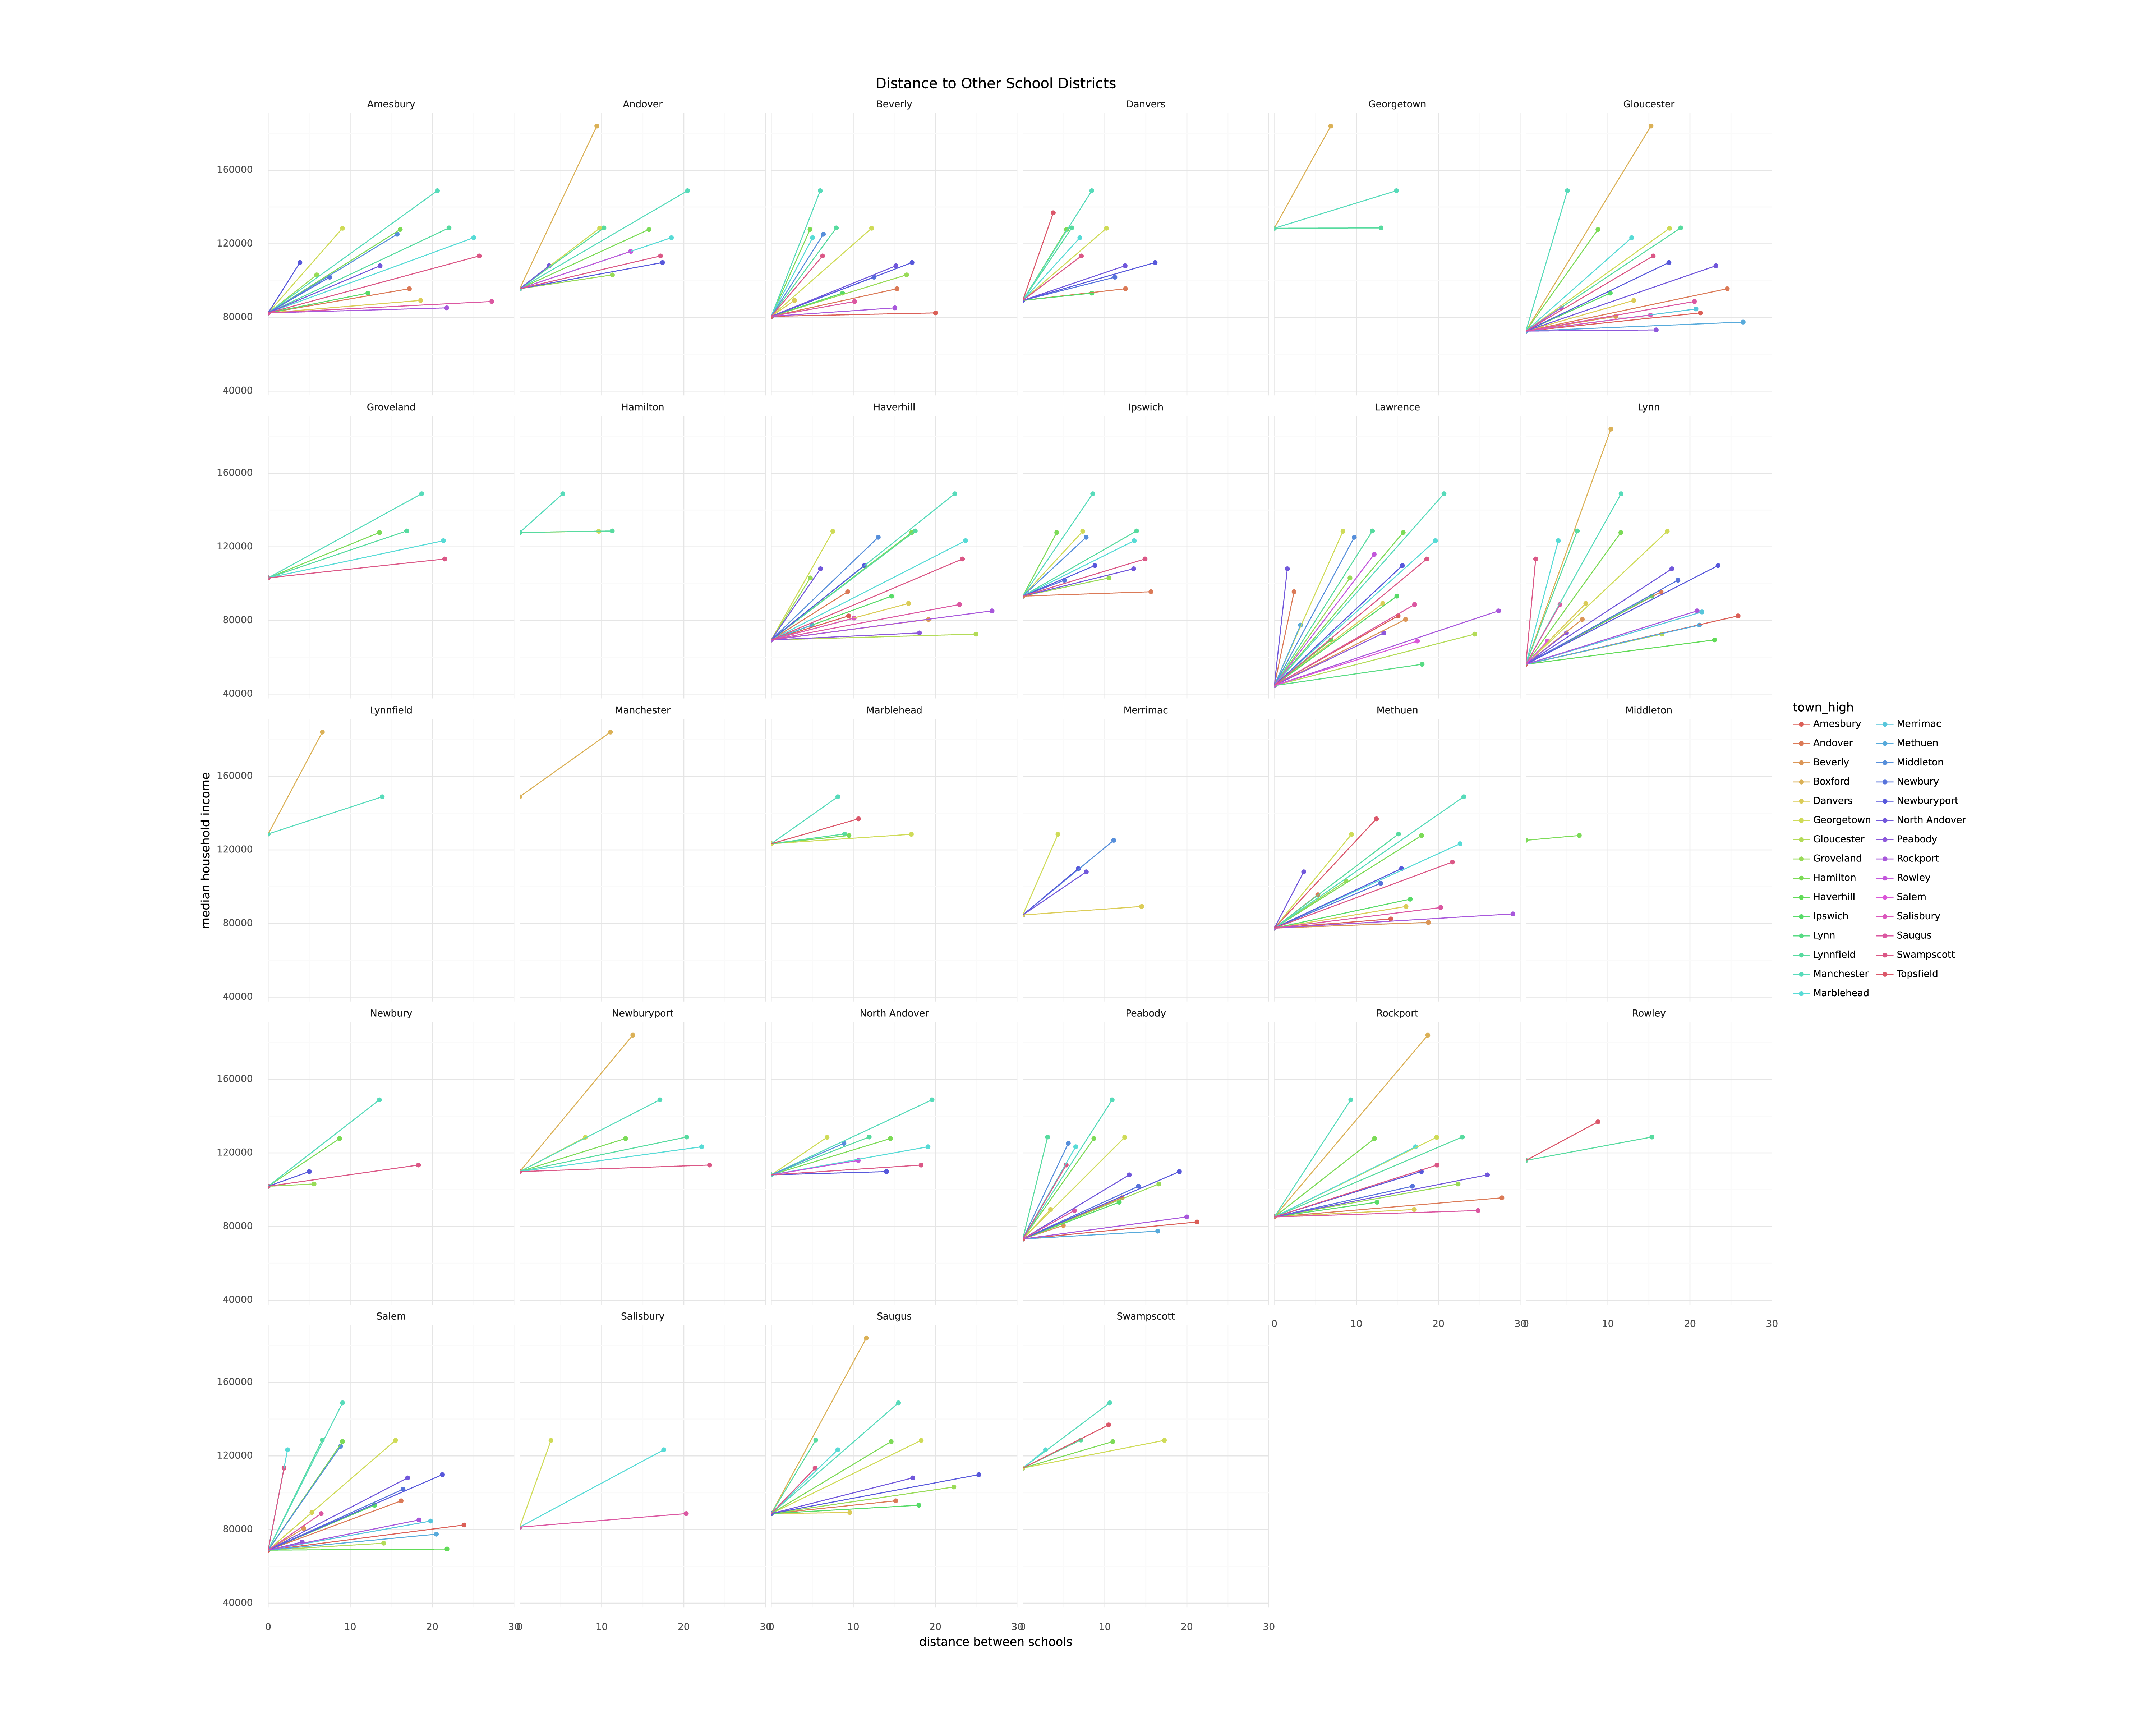
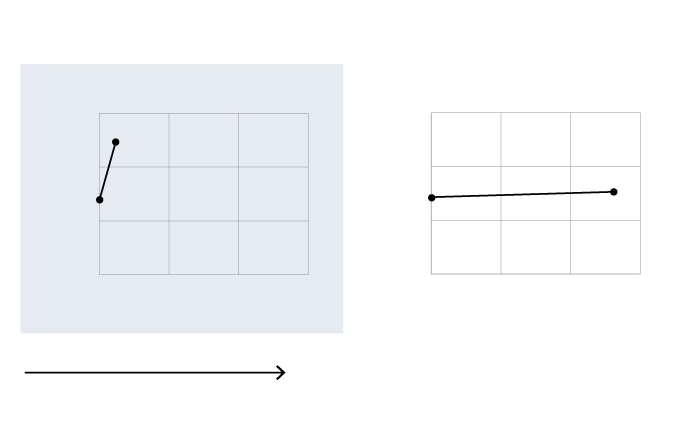
I first began by looking at median household income in relationship to the distance between all the school districts in the county. How close can one district be to another but have a large gap in income? It turns out, very close.
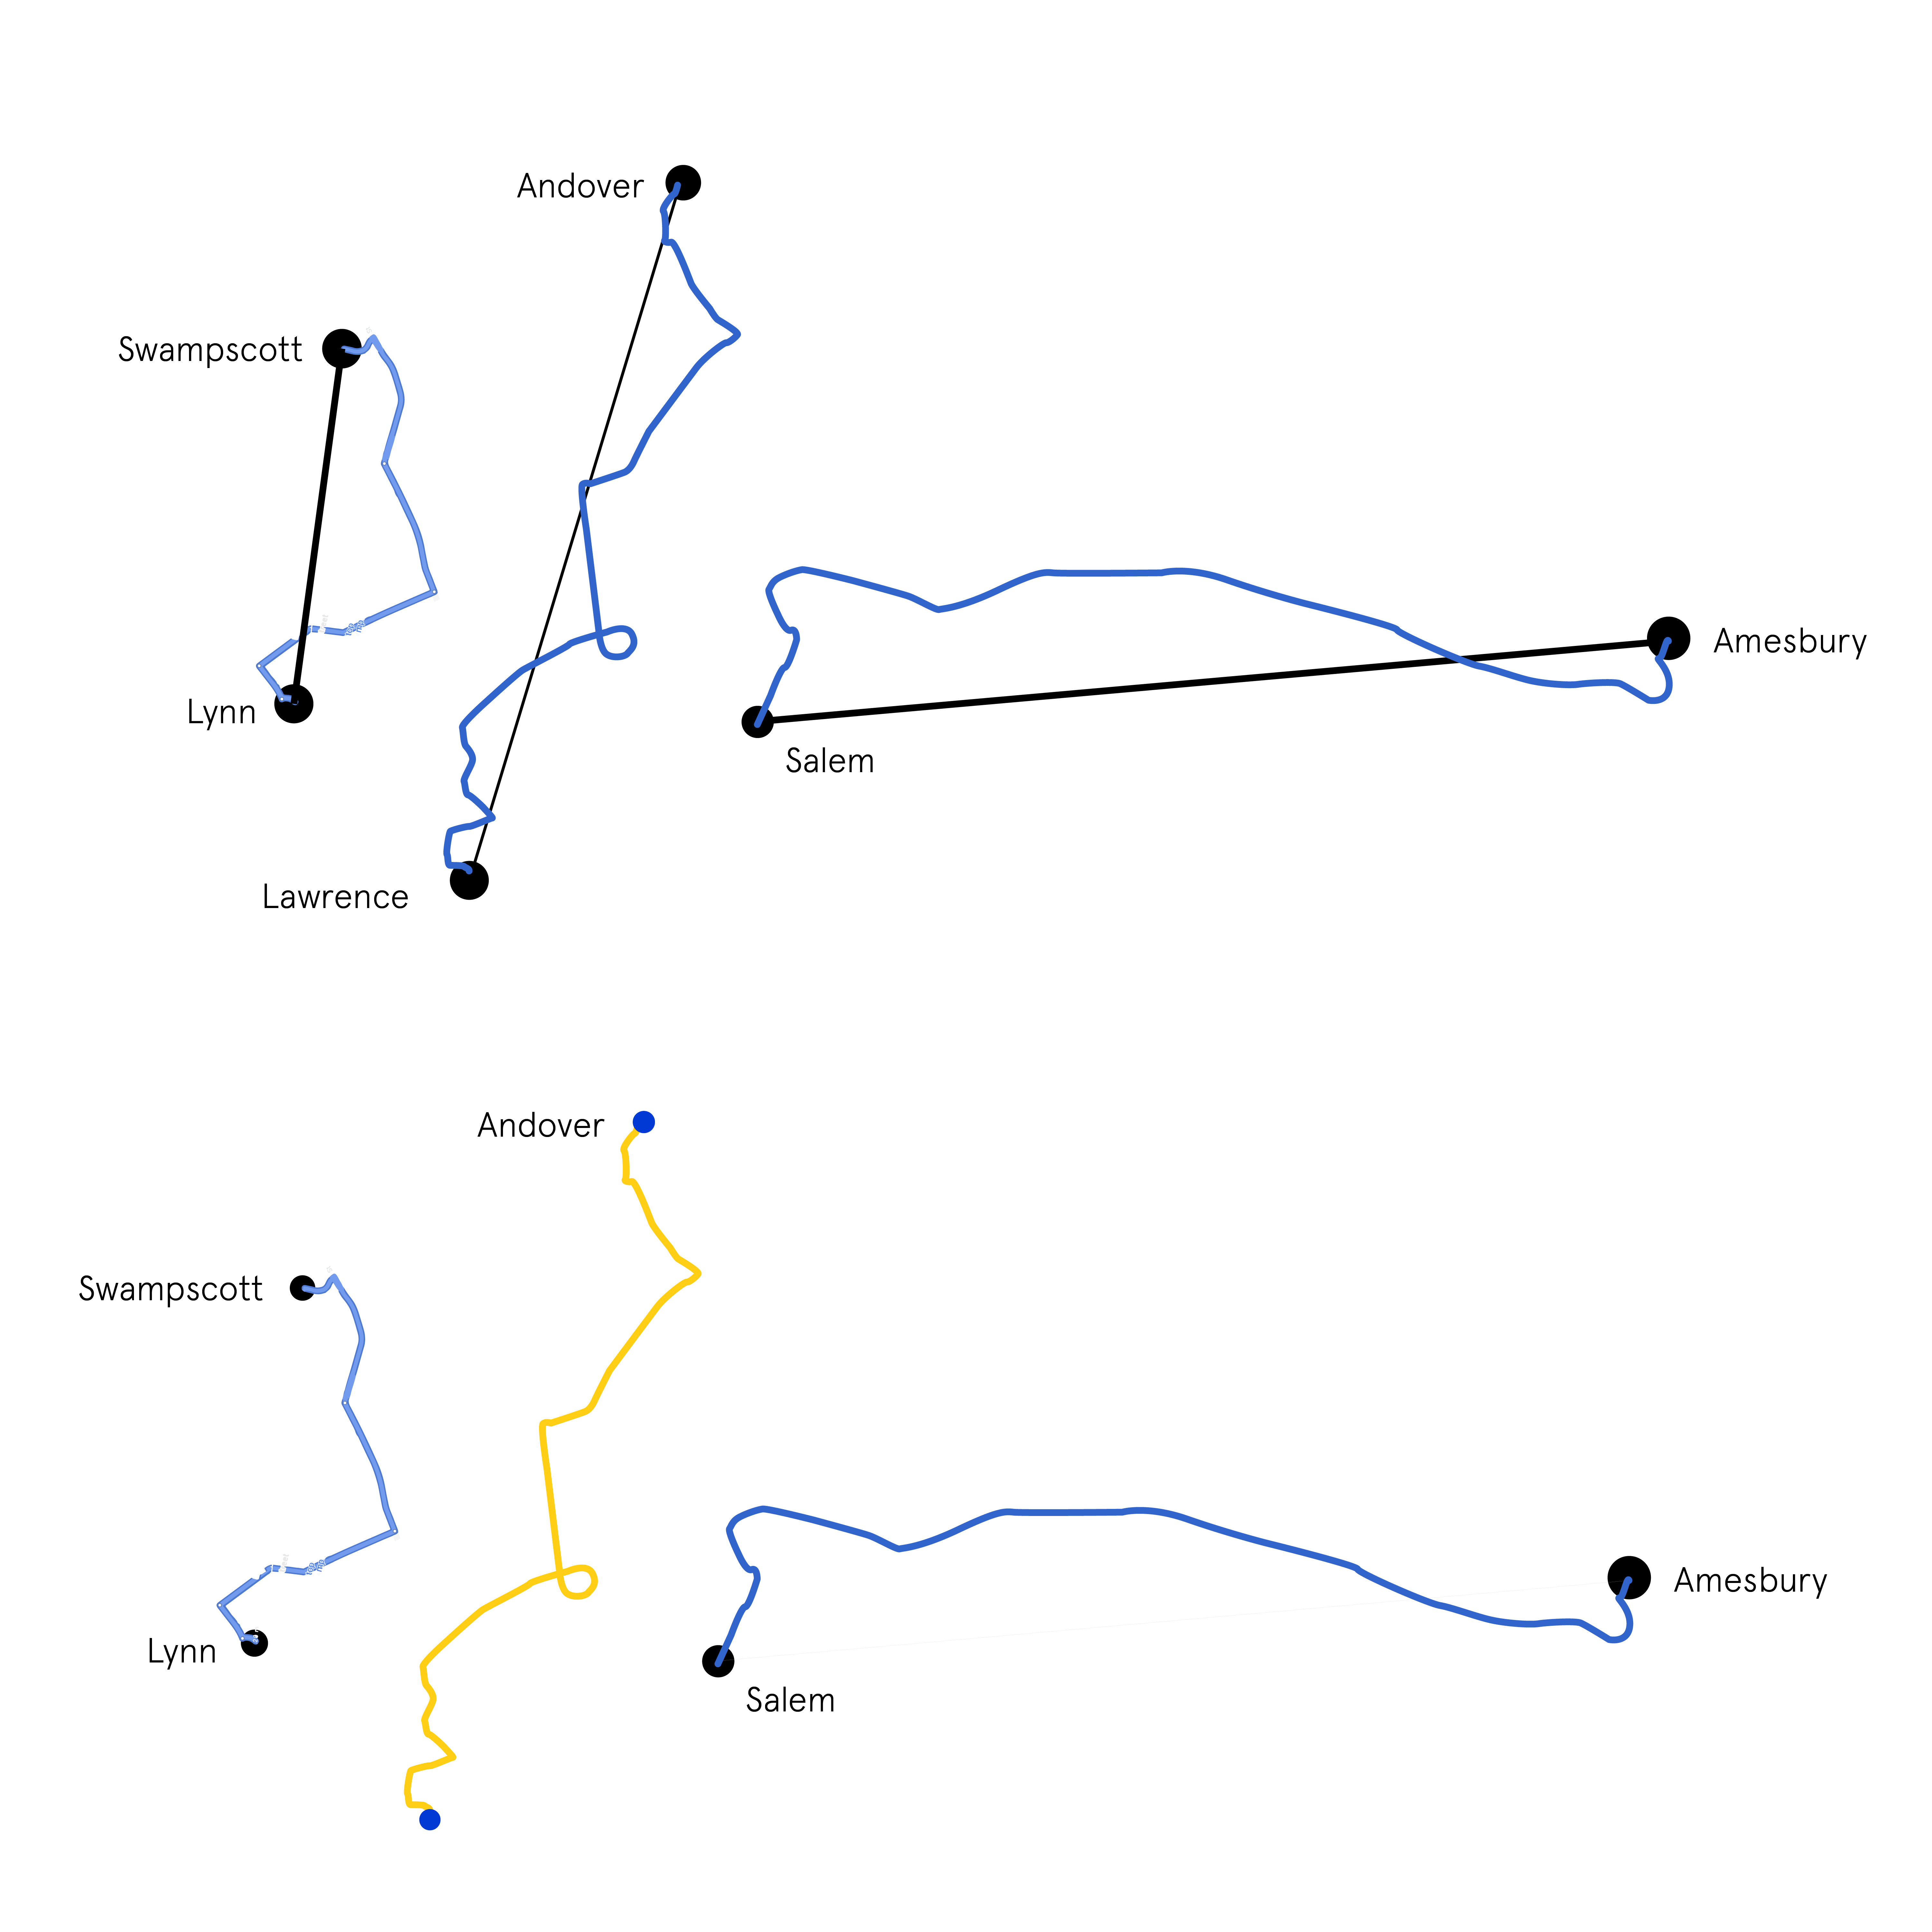
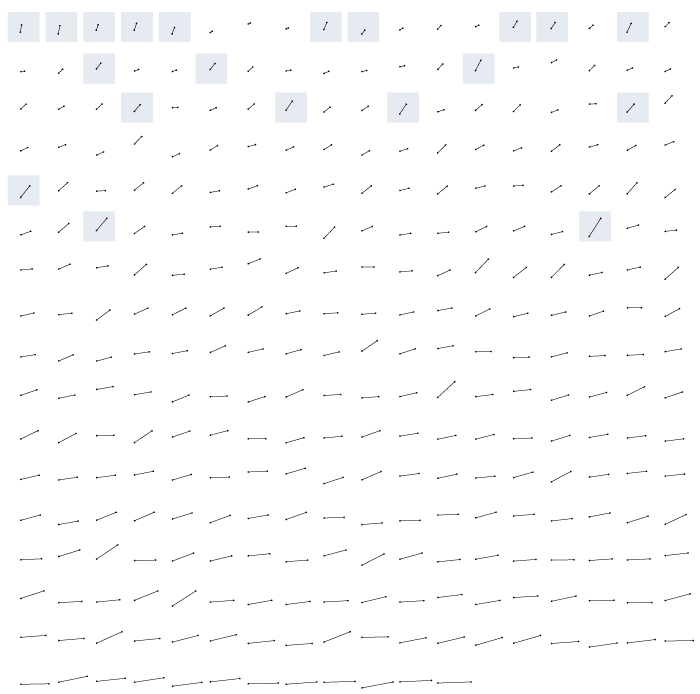
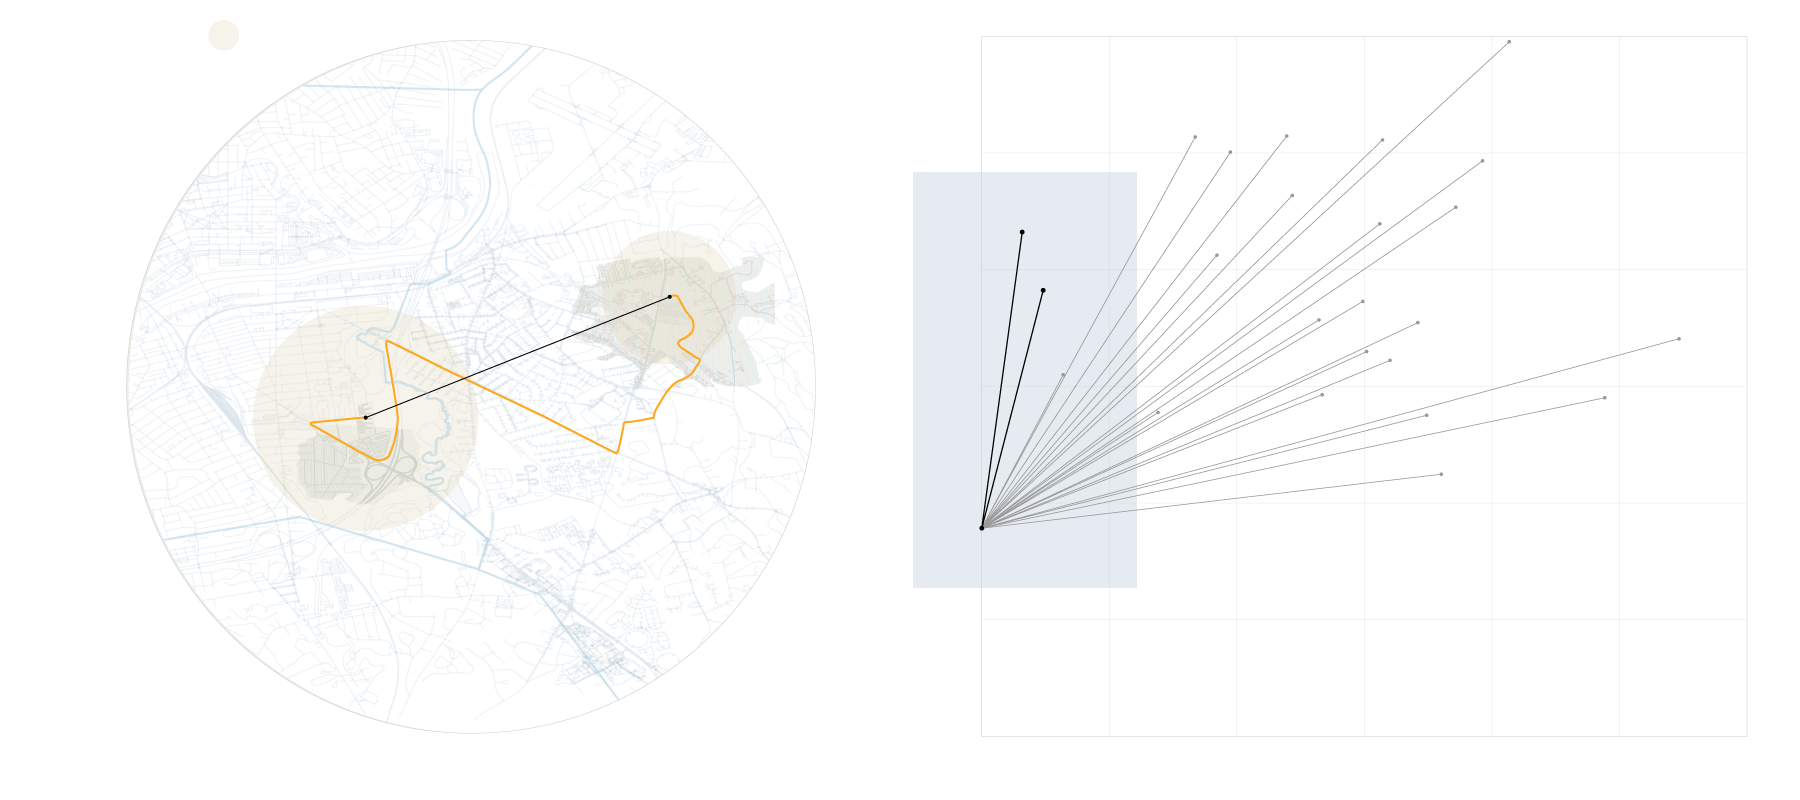
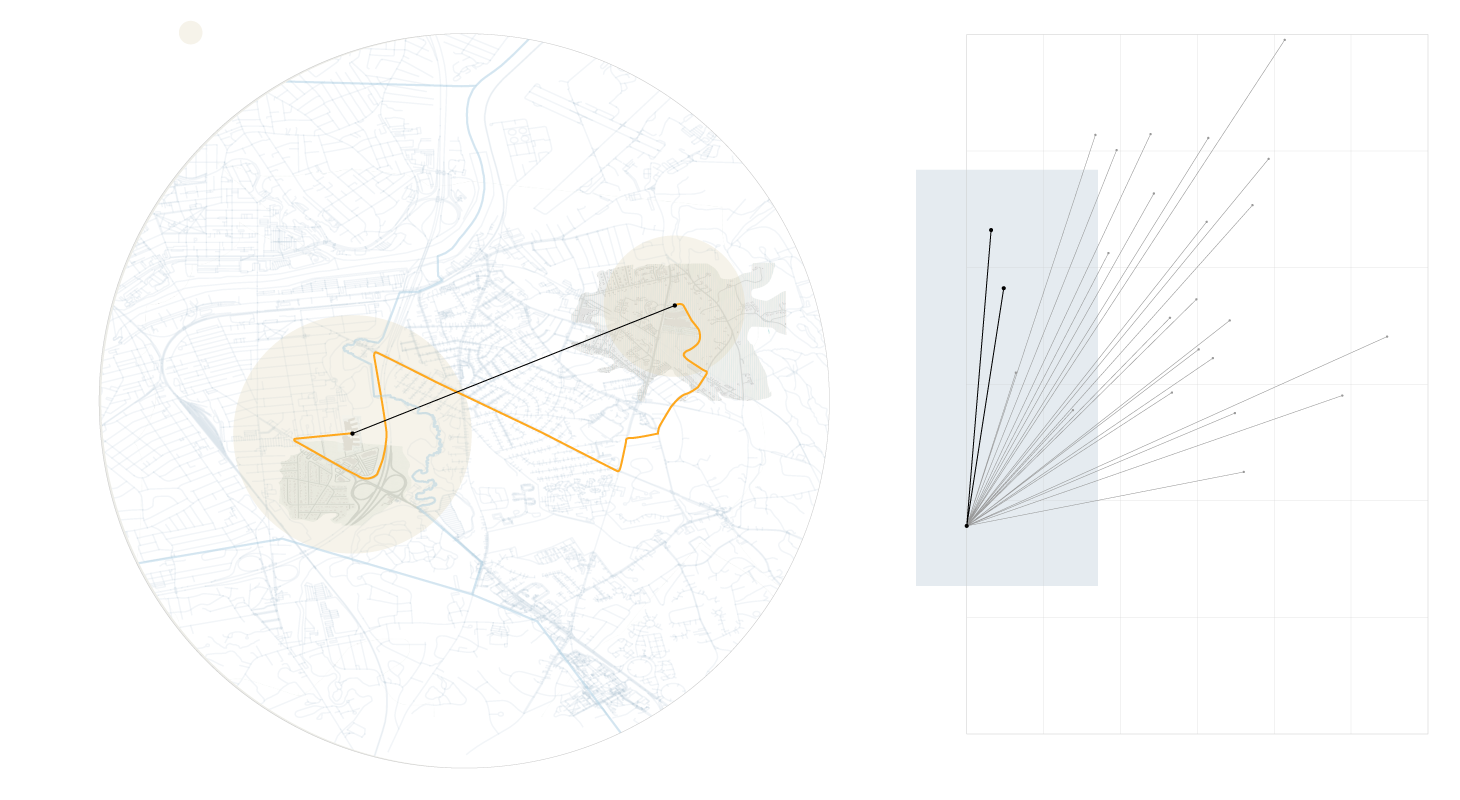
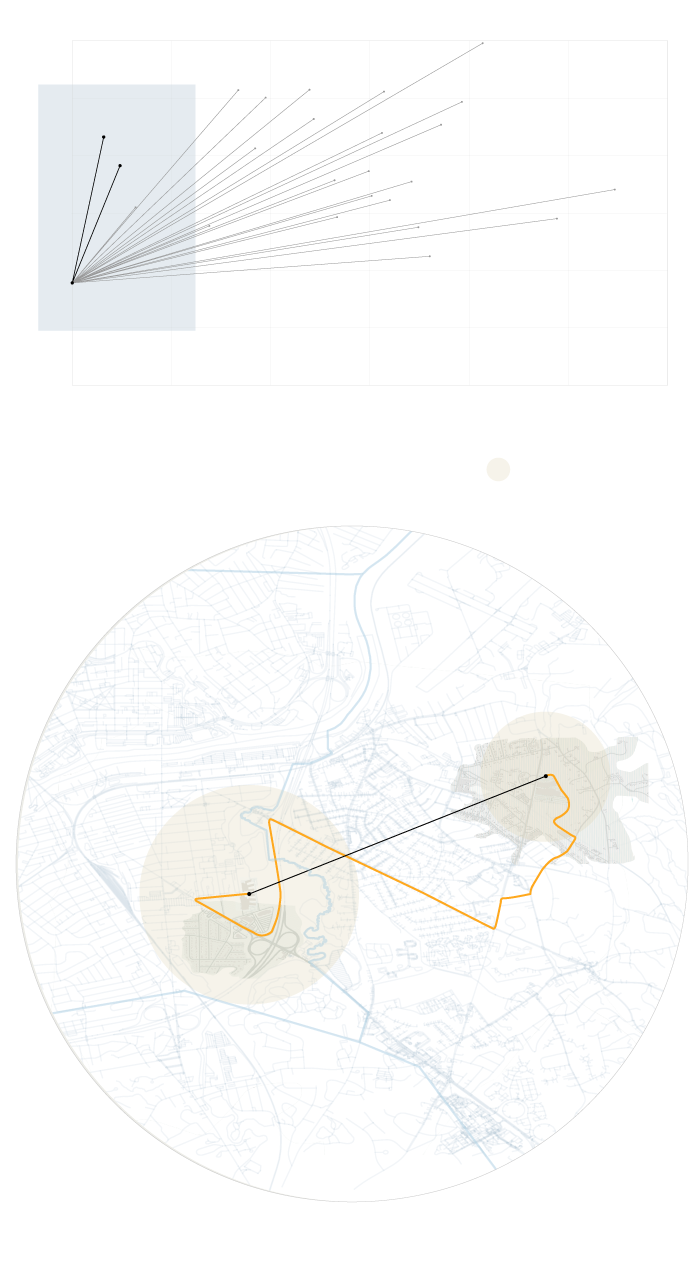
Some neighboring school districts in Essex County have high income disparities
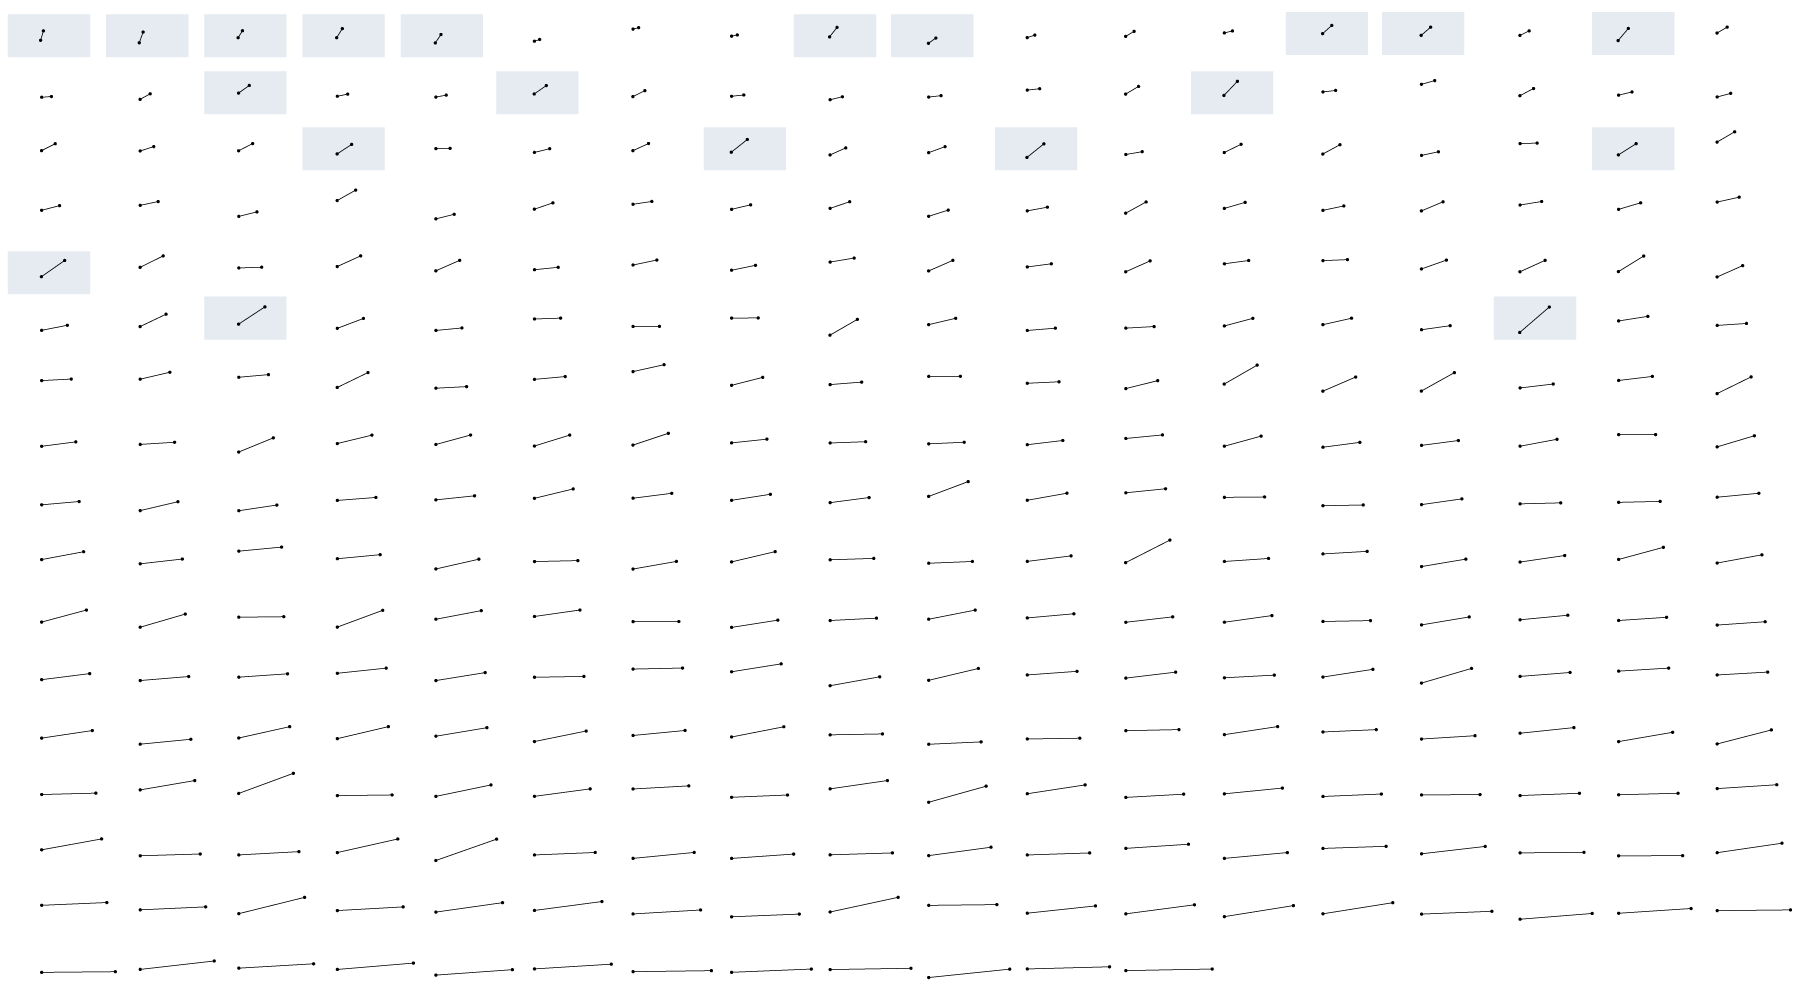
The steeper the line, the bigger disparity in income between two nearby school districts. The blue boxes denote the twenty steepest lines.
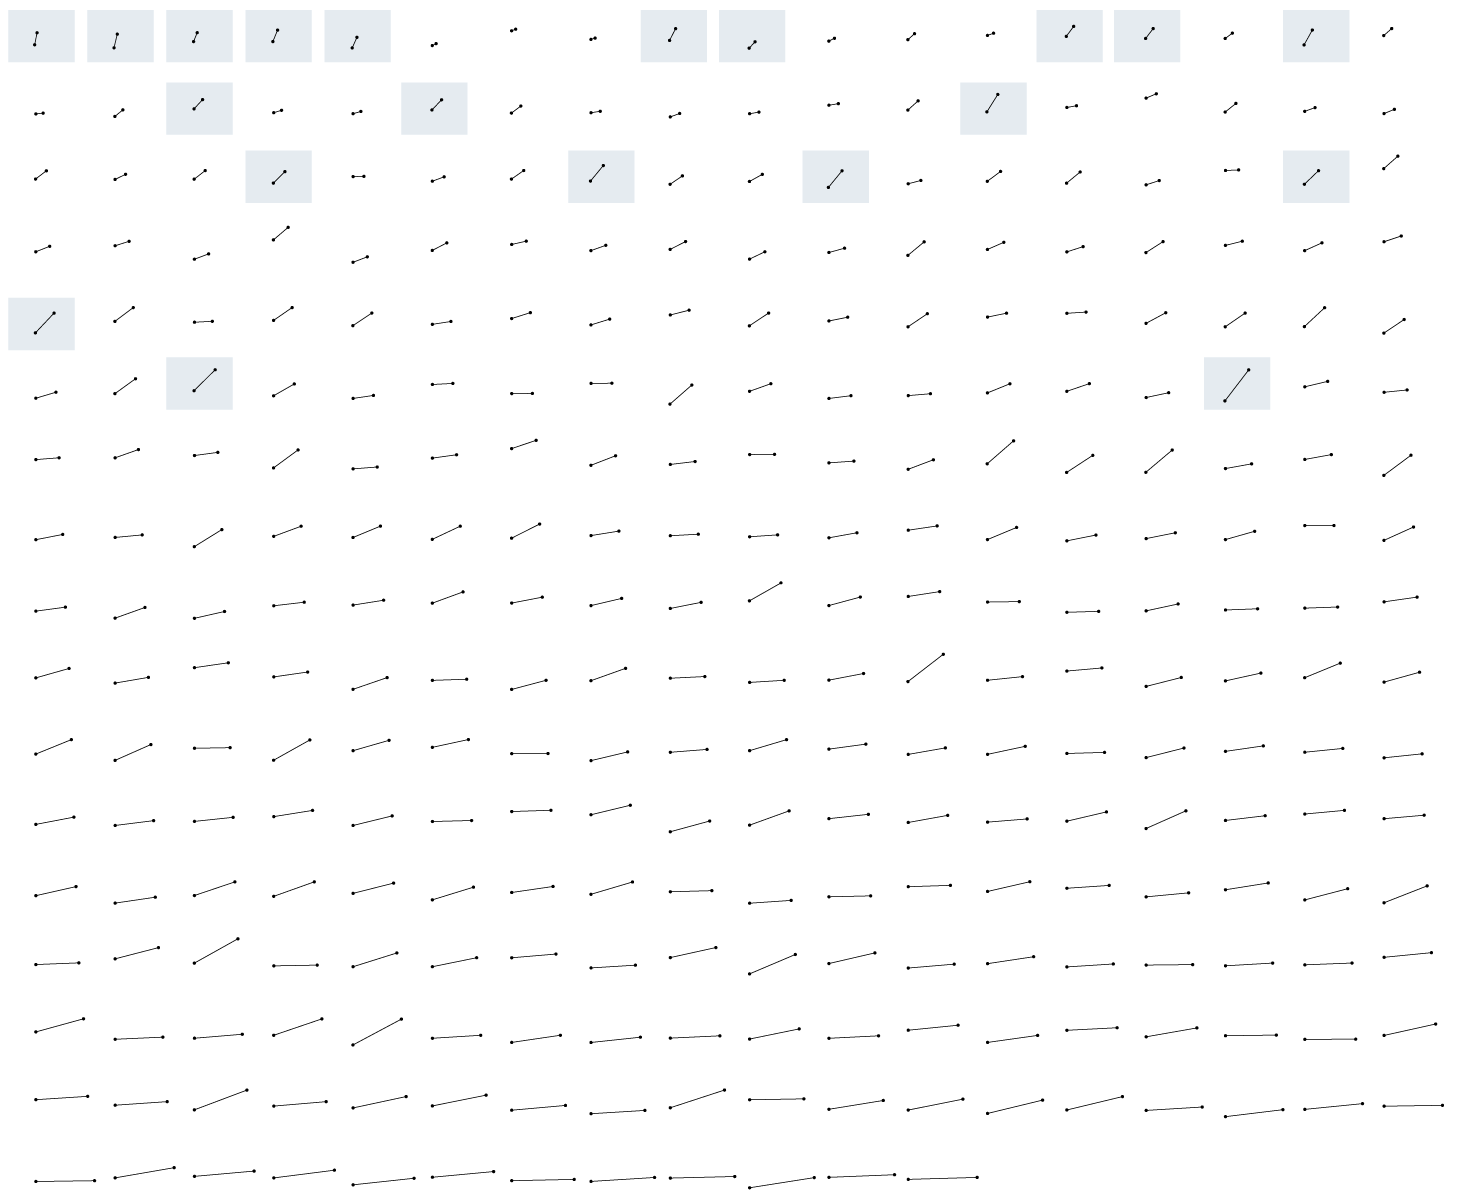
Source: U.S. Census Bureau, American Community Survey (ACS) 2015-2019, GPS Locations of High Schools
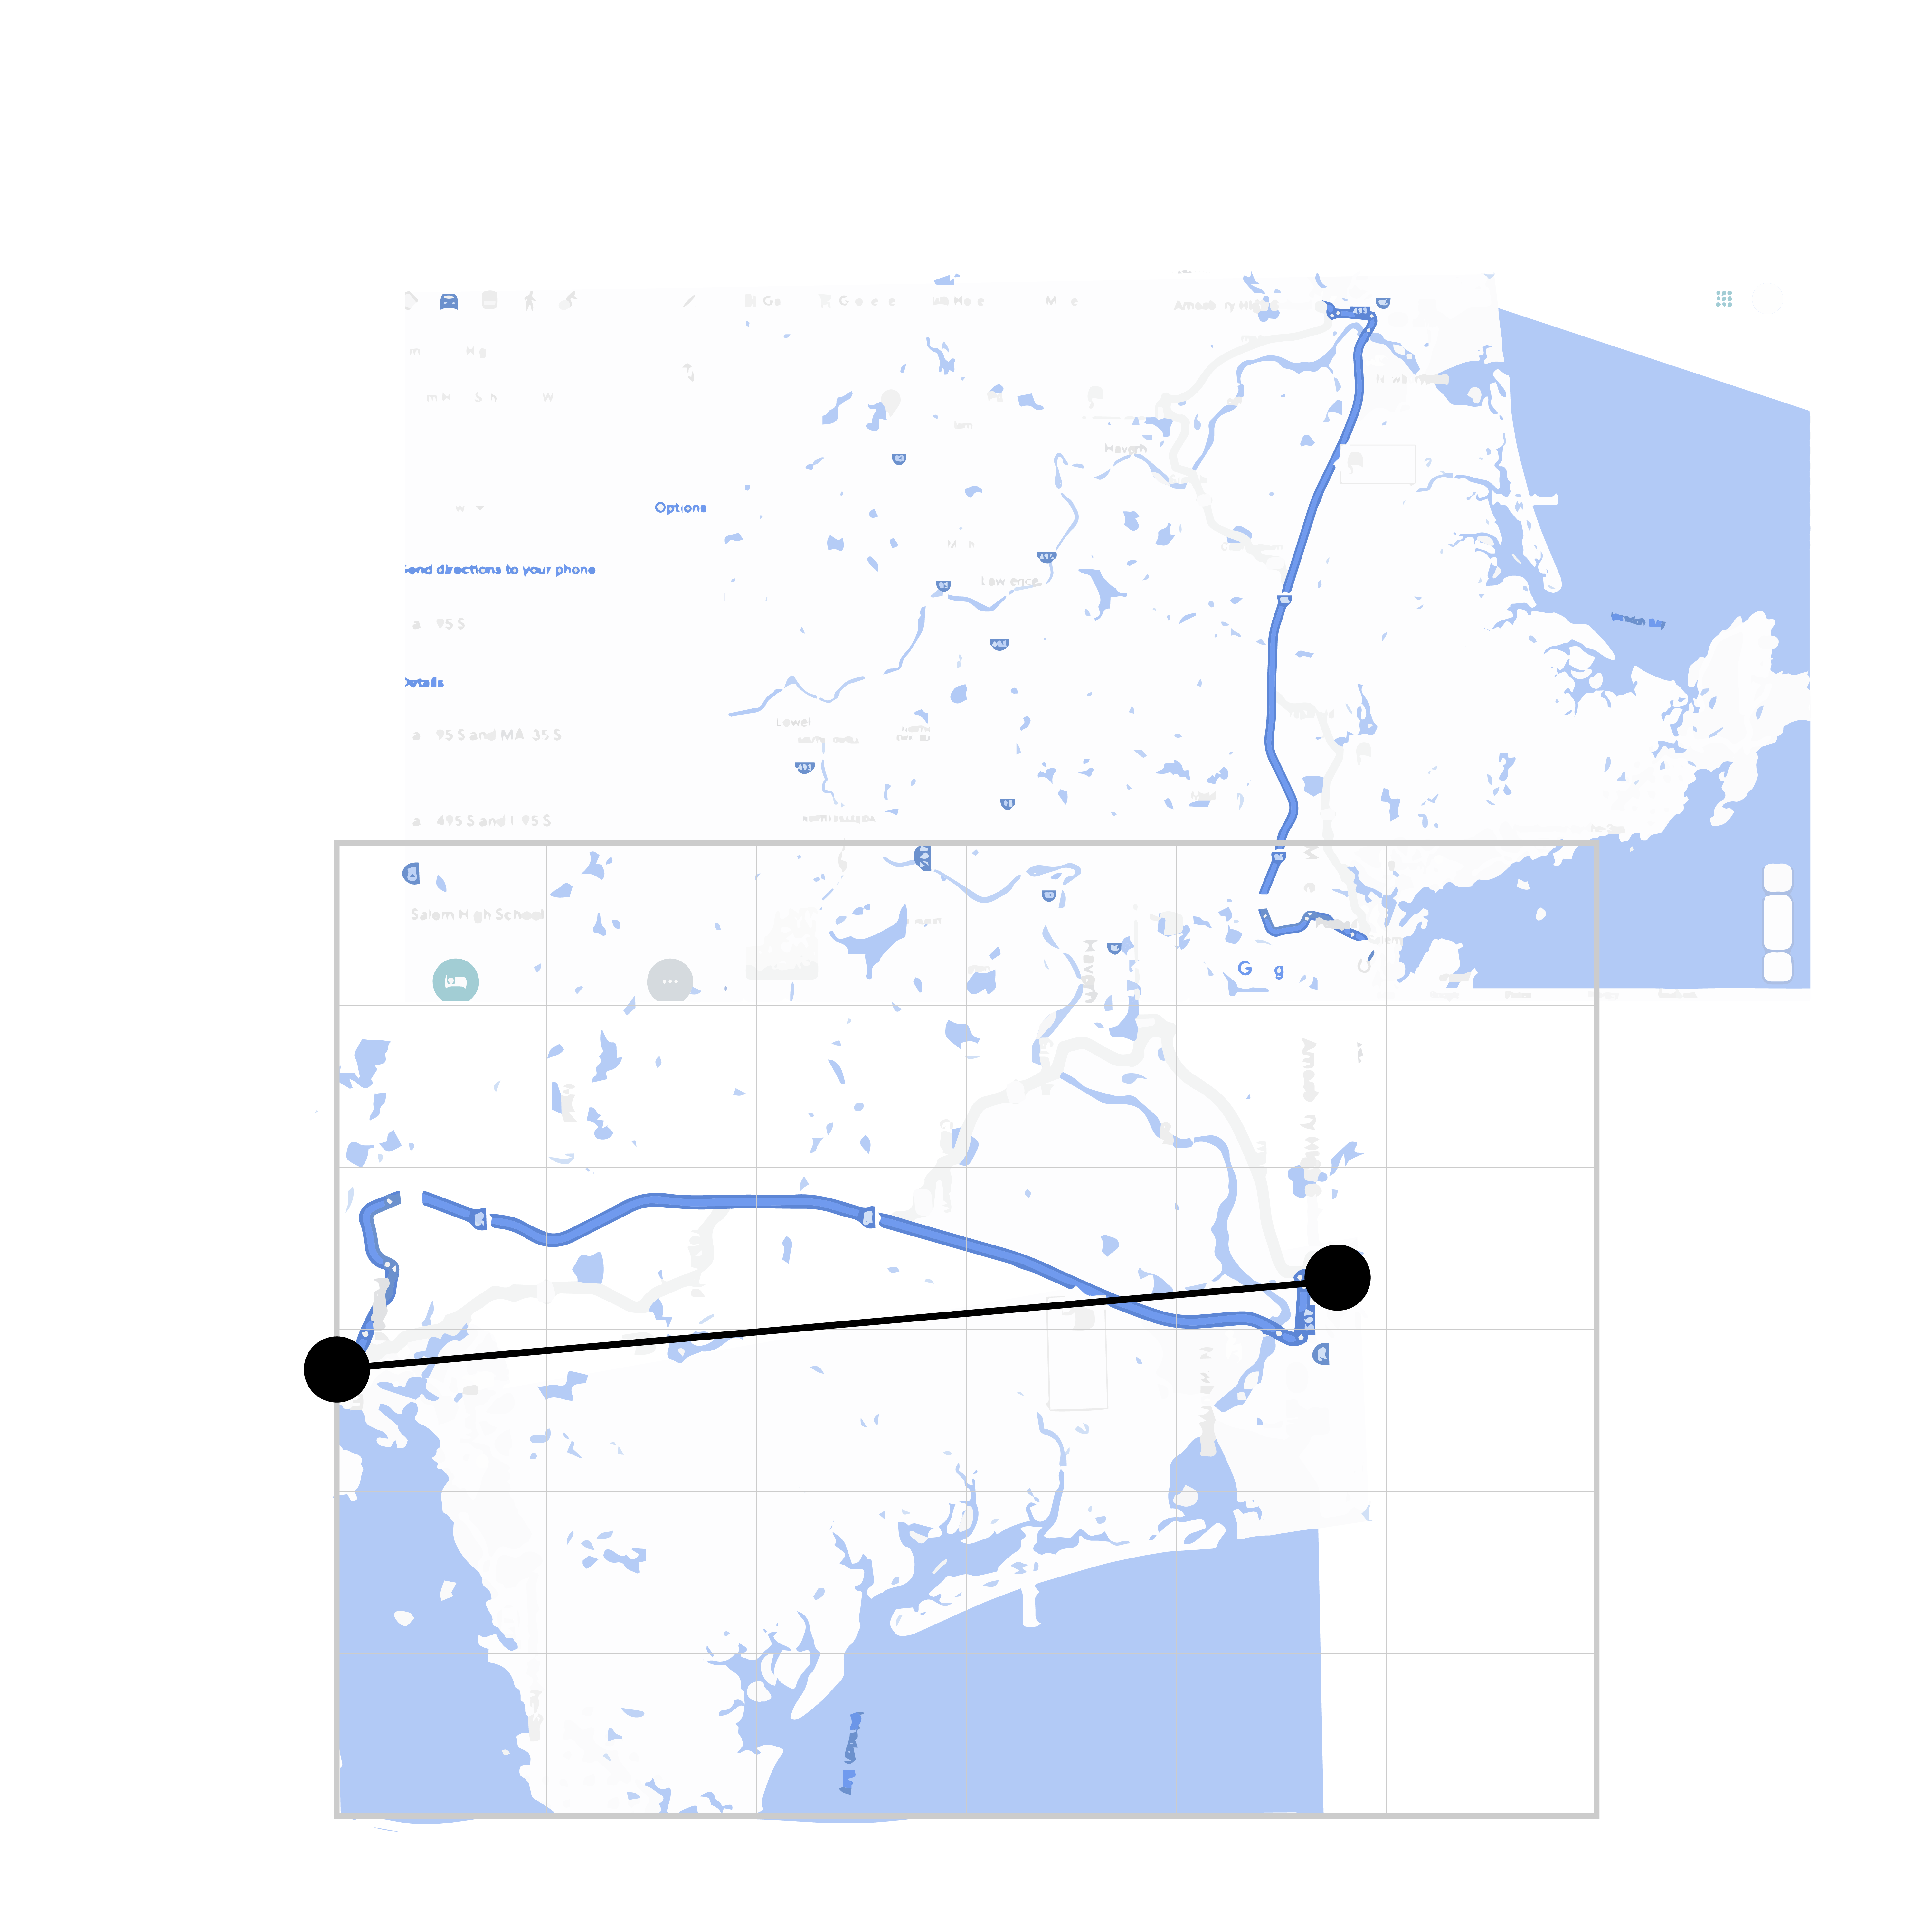
For example, Salem and Marblehead are neighboring school districts with high income disparities. Inversely, Gloucester and Methuen are over 25 miles apart but have similar household median incomes.
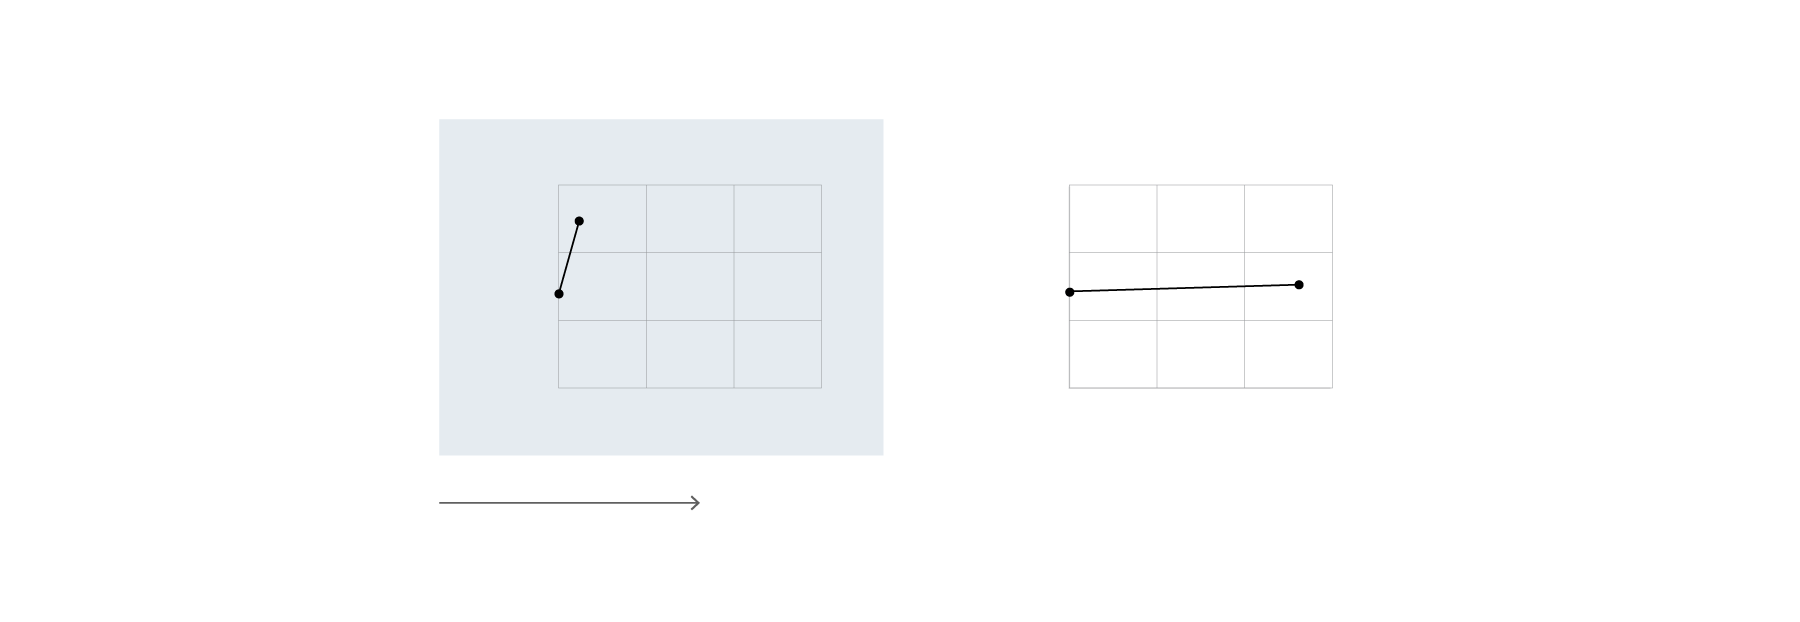
Salem to Marblehead
Gloucester to Methuen
150k
150k
100
100
50
50
0
0
0
10
20
30mi
0
10
20
30mi
Distance between School Districts
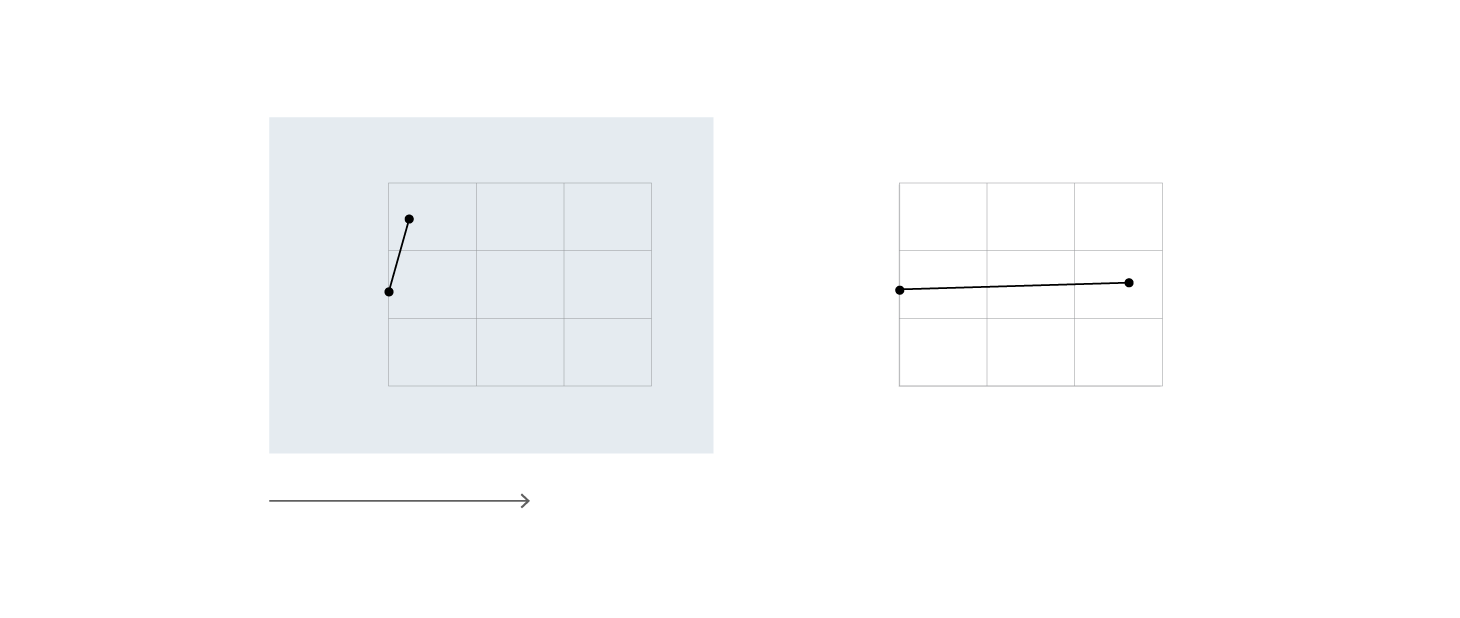
The steeper the line, the bigger the disparity in income. The blue boxes denote the twenty steepest lines.
Salem to Marblehead
Gloucester to Methuen
150k
150k
100
100
50
50
0
0
0
10
20
30mi
0
10
20
30mi
Distance between School Districts
Salem to Marblehead
Gloucester to Methuen
150k
150k
100
100
50
50
0
0
0
10
20
30mi
0
10
20
30mi
Distance between School Districts
Through this series of slope graphs, I was able to identify clusters of nearby school districts with large income disparities.
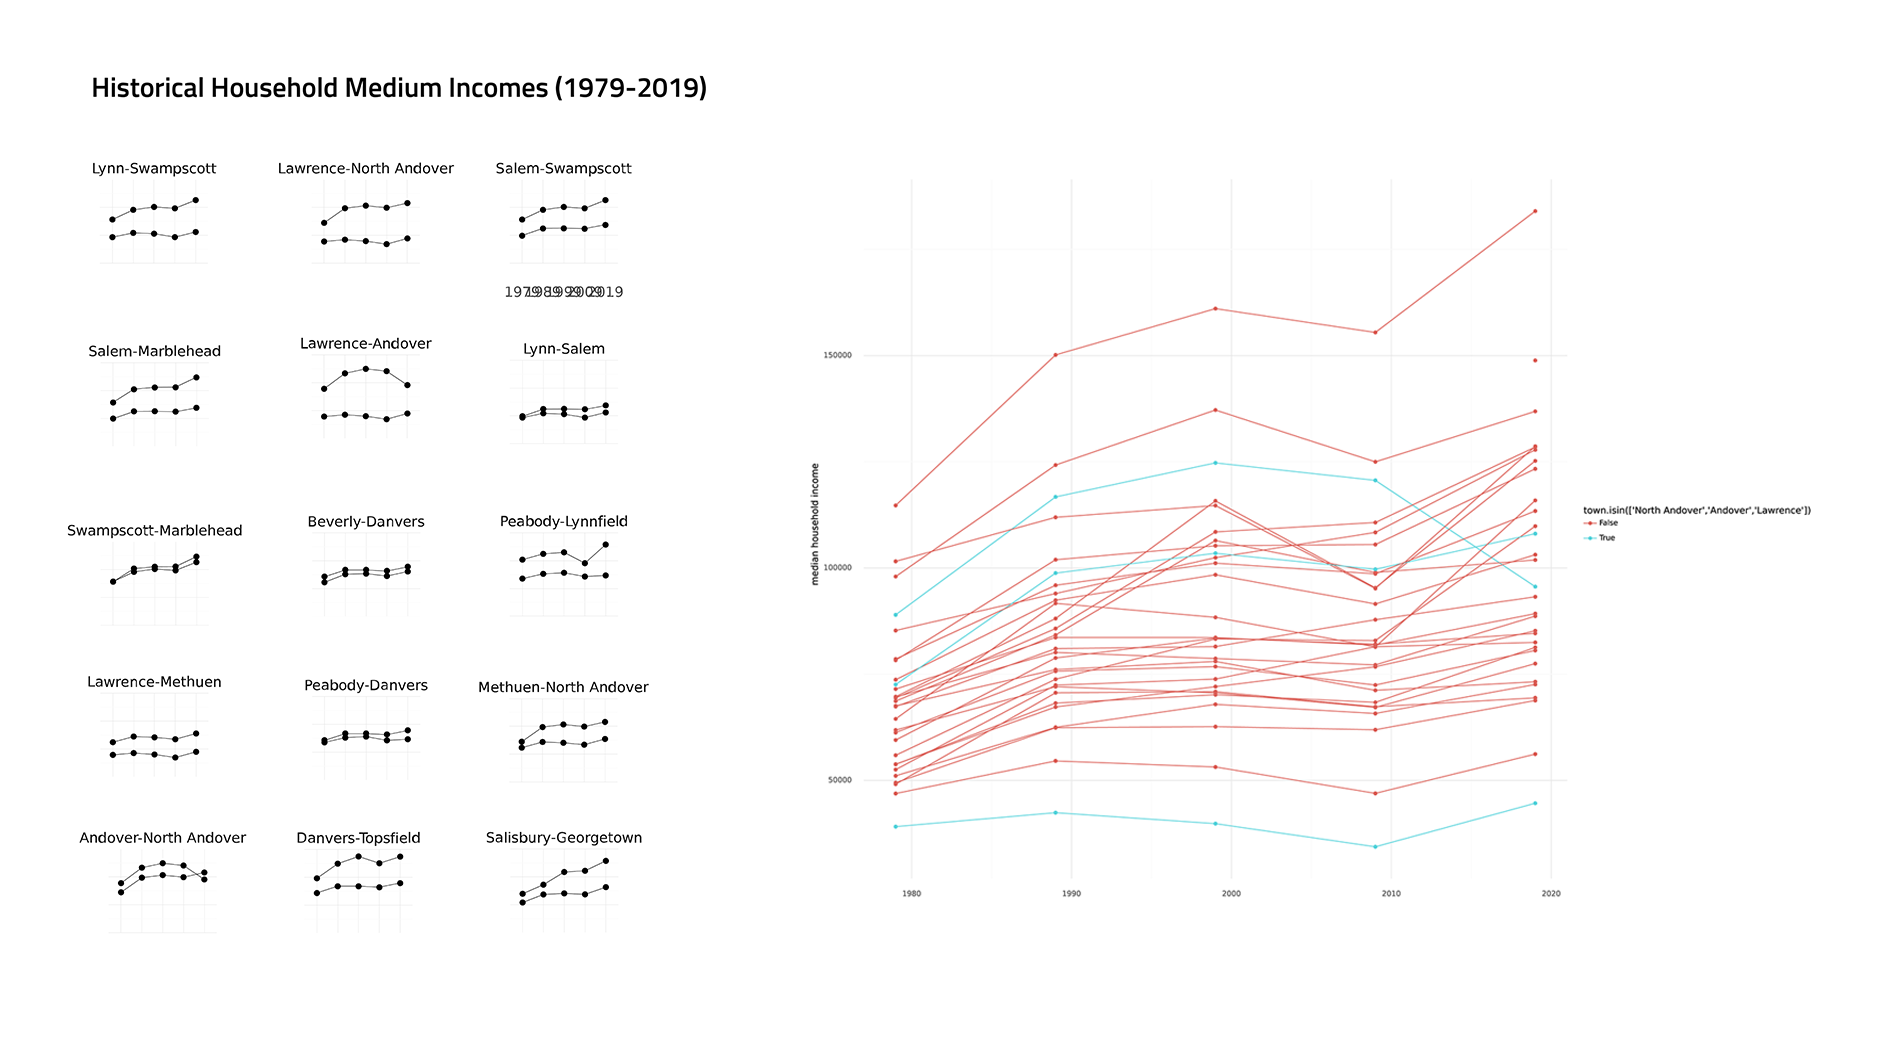
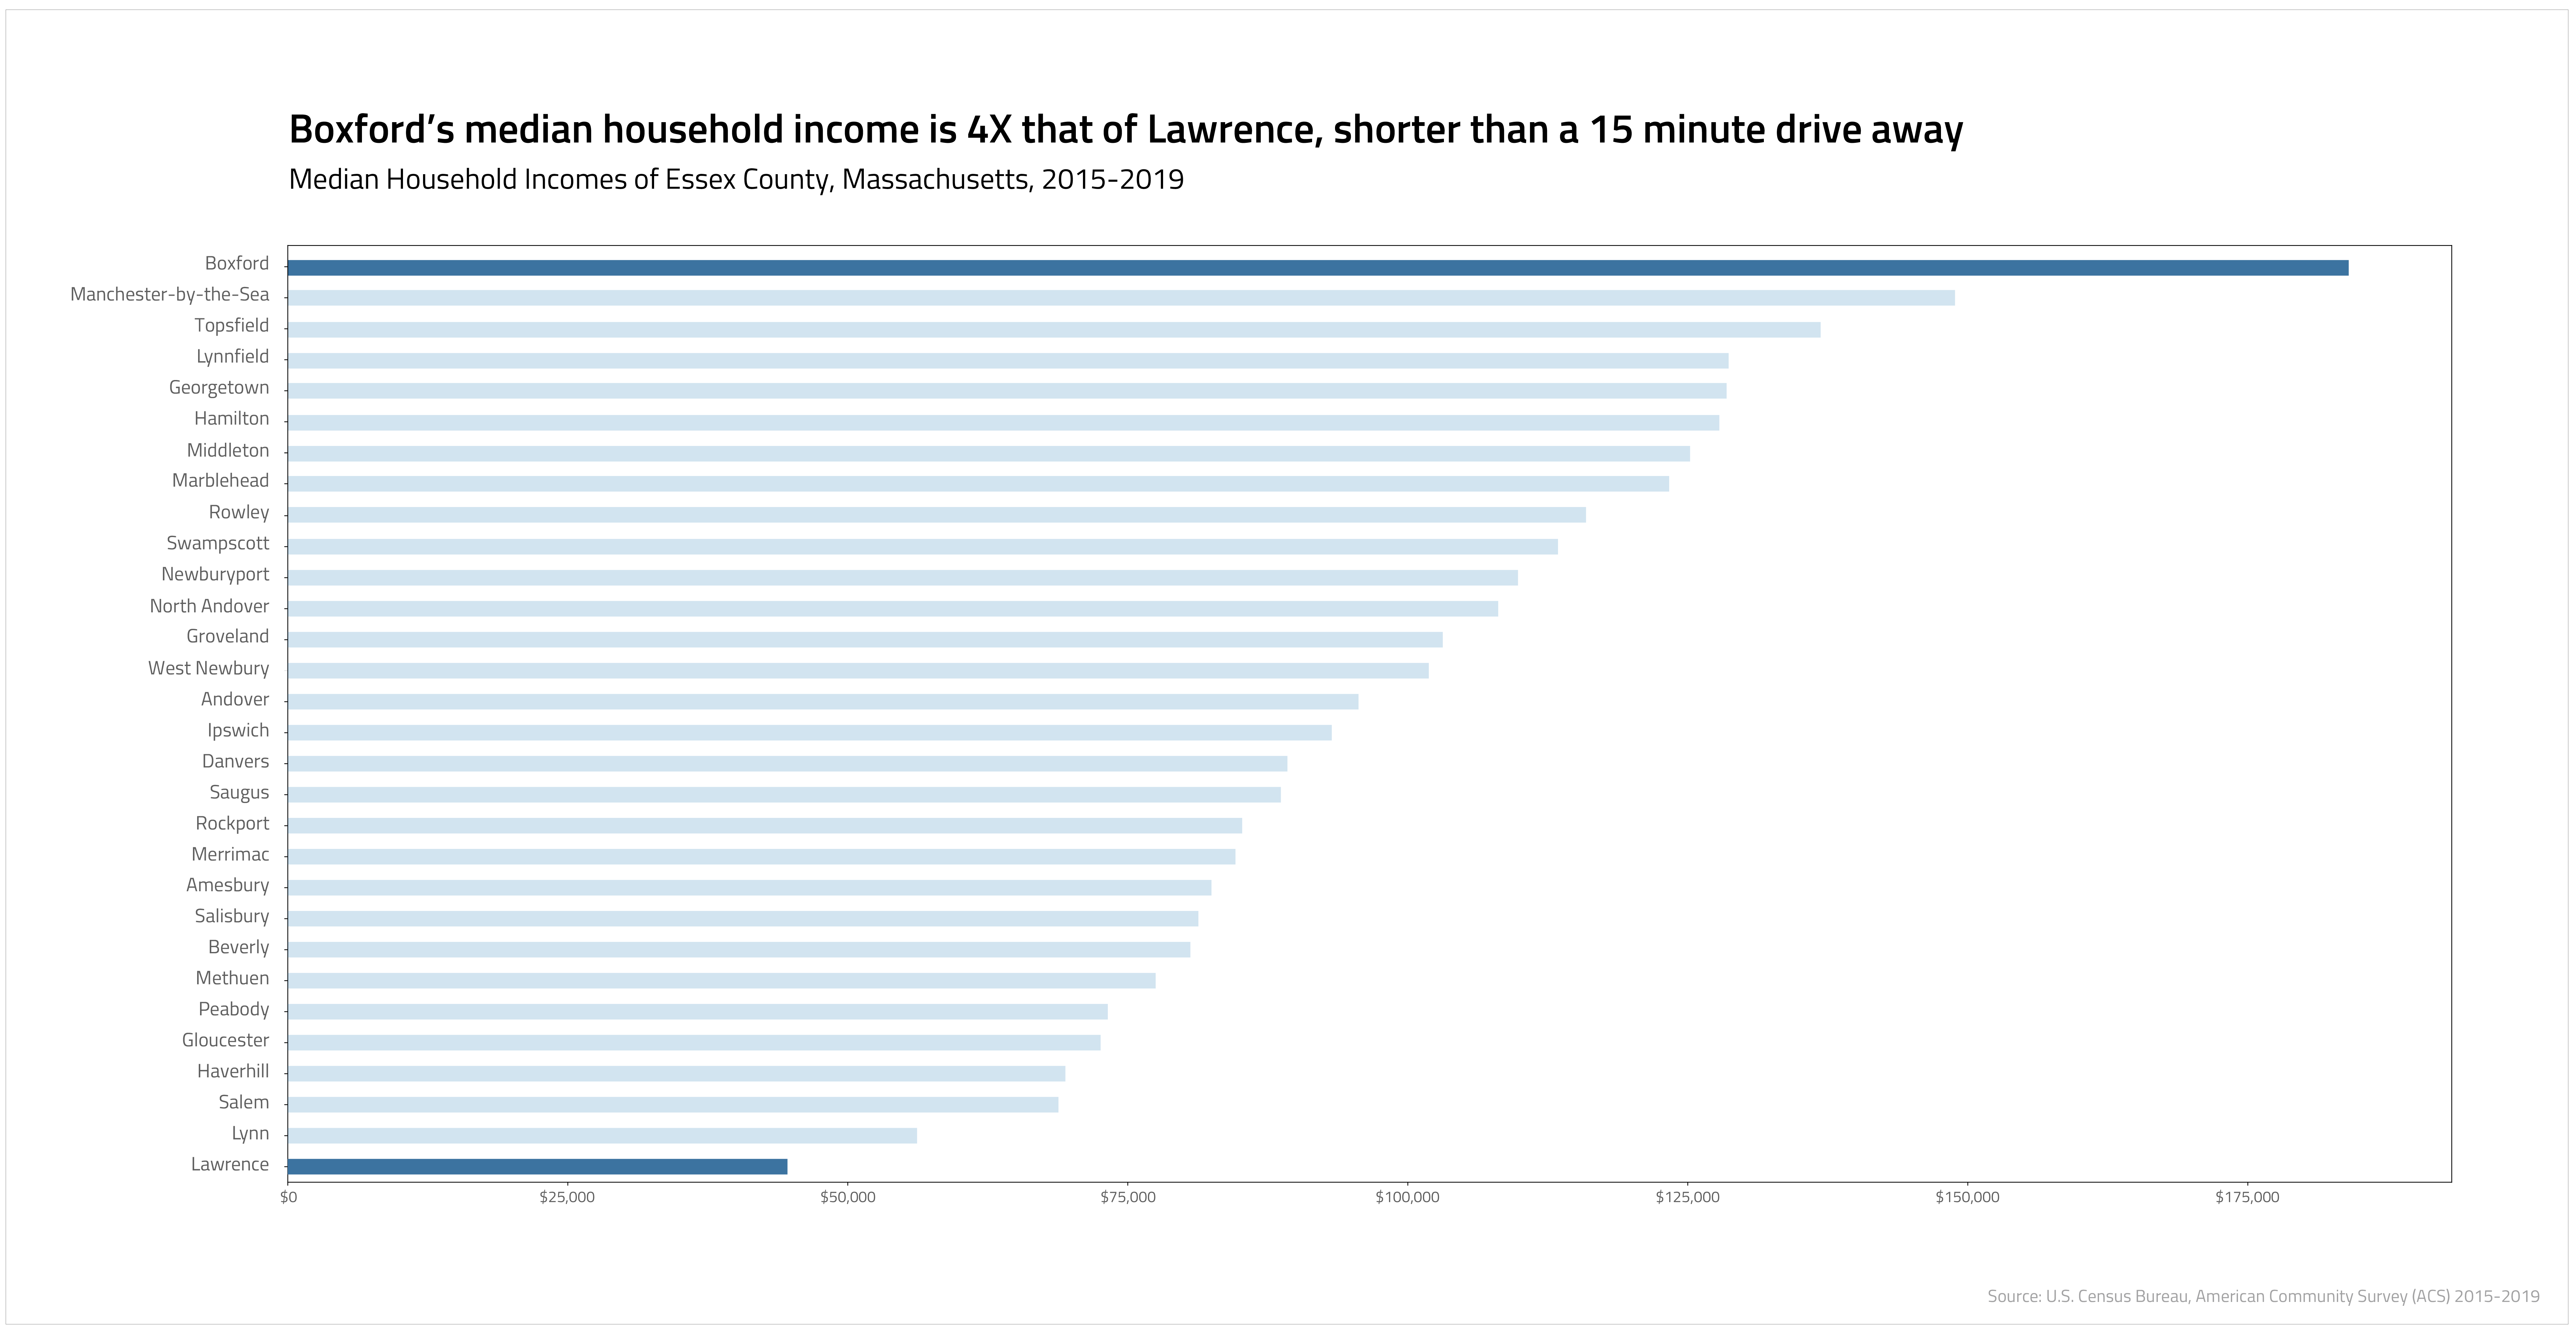
One such cluster includes the towns of Andover, Lawrence, and North Andover. The high schools of the three towns are within 2.5 miles (as the crow flies) of one another but the communities differ demographically. Lawrence is a smaller city with a population nearly three times the size of North Andover and over nine times the size of Andover even though the towns border one another.
80 percent of the population of Lawrence is Hispanic or Latinx with a household median income of $44,600. The other two towns’ median incomes are twice that of Lawrence and are a majority white.
Andover and North Andover have median incomes 2X nearby Lawrence
Median household income differences between Lawrence and other school districts in Essex County, MA
Student Population
Lawrence: 12,786
N. Andover: 4,493
Andover: 5,456
150k
N. Andover
Andover
Lawrence
North Andover
Lawrence
Andover
0
Distance: 1.6 mi —
Driving Distance: 3.9 mi, 9 min. —
30mi
0
Student Population
Lawrence: 12,786
N. Andover: 4,493
Andover: 5,456
150k
N. Andover
Andover
Lawrence
North Andover
Lawrence
Andover
0
Distance: 1.6 mi —
Driving Distance: 3.9 mi, 9 min. —
30mi
0
150k
N. Andover
Andover
Lawrence
0k
0
30mi
Driving Distance: 3.9 mi, 9 min. —
Distance: 1.6 mi —
Student Population
Lawrence: 12,786
N. Andover: 4,493
Andover: 5,456
Lawrence
North Andover
Andover
Source: U.S. Census Bureau, American Community Survey (ACS) 2015-2019, National Center for Education Statistics (NCES), GPS Locations of High Schools, MassGIS, Open Street Maps, Google Maps
Beyond the gaps in income, the contrast in racial makeup of these three towns is substantial. Massachusetts has a long history of racial and economic de facto segregation and even within the county, nearby Haverhill was highlighted by University of Richmond's recent project on the history of redlining.
Many towns in the county maintain bylaws that make it difficult to build affordable housing, which tends to keep the towns wealthier and whiter.Busing: A Historied Attempt at Racial Balance
Famously in 1975, Boston and its neighboring suburbs attempted to desegregate the schools by requiring some students from wealthier and whiter communities of the suburbs to be bussed to schools in the inner-city and some students were bussed from the city out to the suburbs. There was significant backlash. People threw “eggs, bricks, and bottles” at buses carrying black children and police wore combat gear to fight protestors. Eventually, the communities abandoned the practice.According to a staff report at the time, the goal of the court ordered desegregation was to achieve “racial balance,” a term used to mean that all schools in the Boston Public School system were to have similar percentages of white and minority school populations. Schools were allowed a “5 percent leeway” between percentages of white and minority students and the report included this example:
White students represent 51 percent of the city’s students, so white enrollment could number from 56 to 46 percent at any citywide school. Black and other minority students, who are 49 percent of the city’s total school enrollment, may range from 54 to 44 percent of enrollment at individual citywide schools.
—Staff Report for the Hearing of the U.S. Commission on Civil Rights
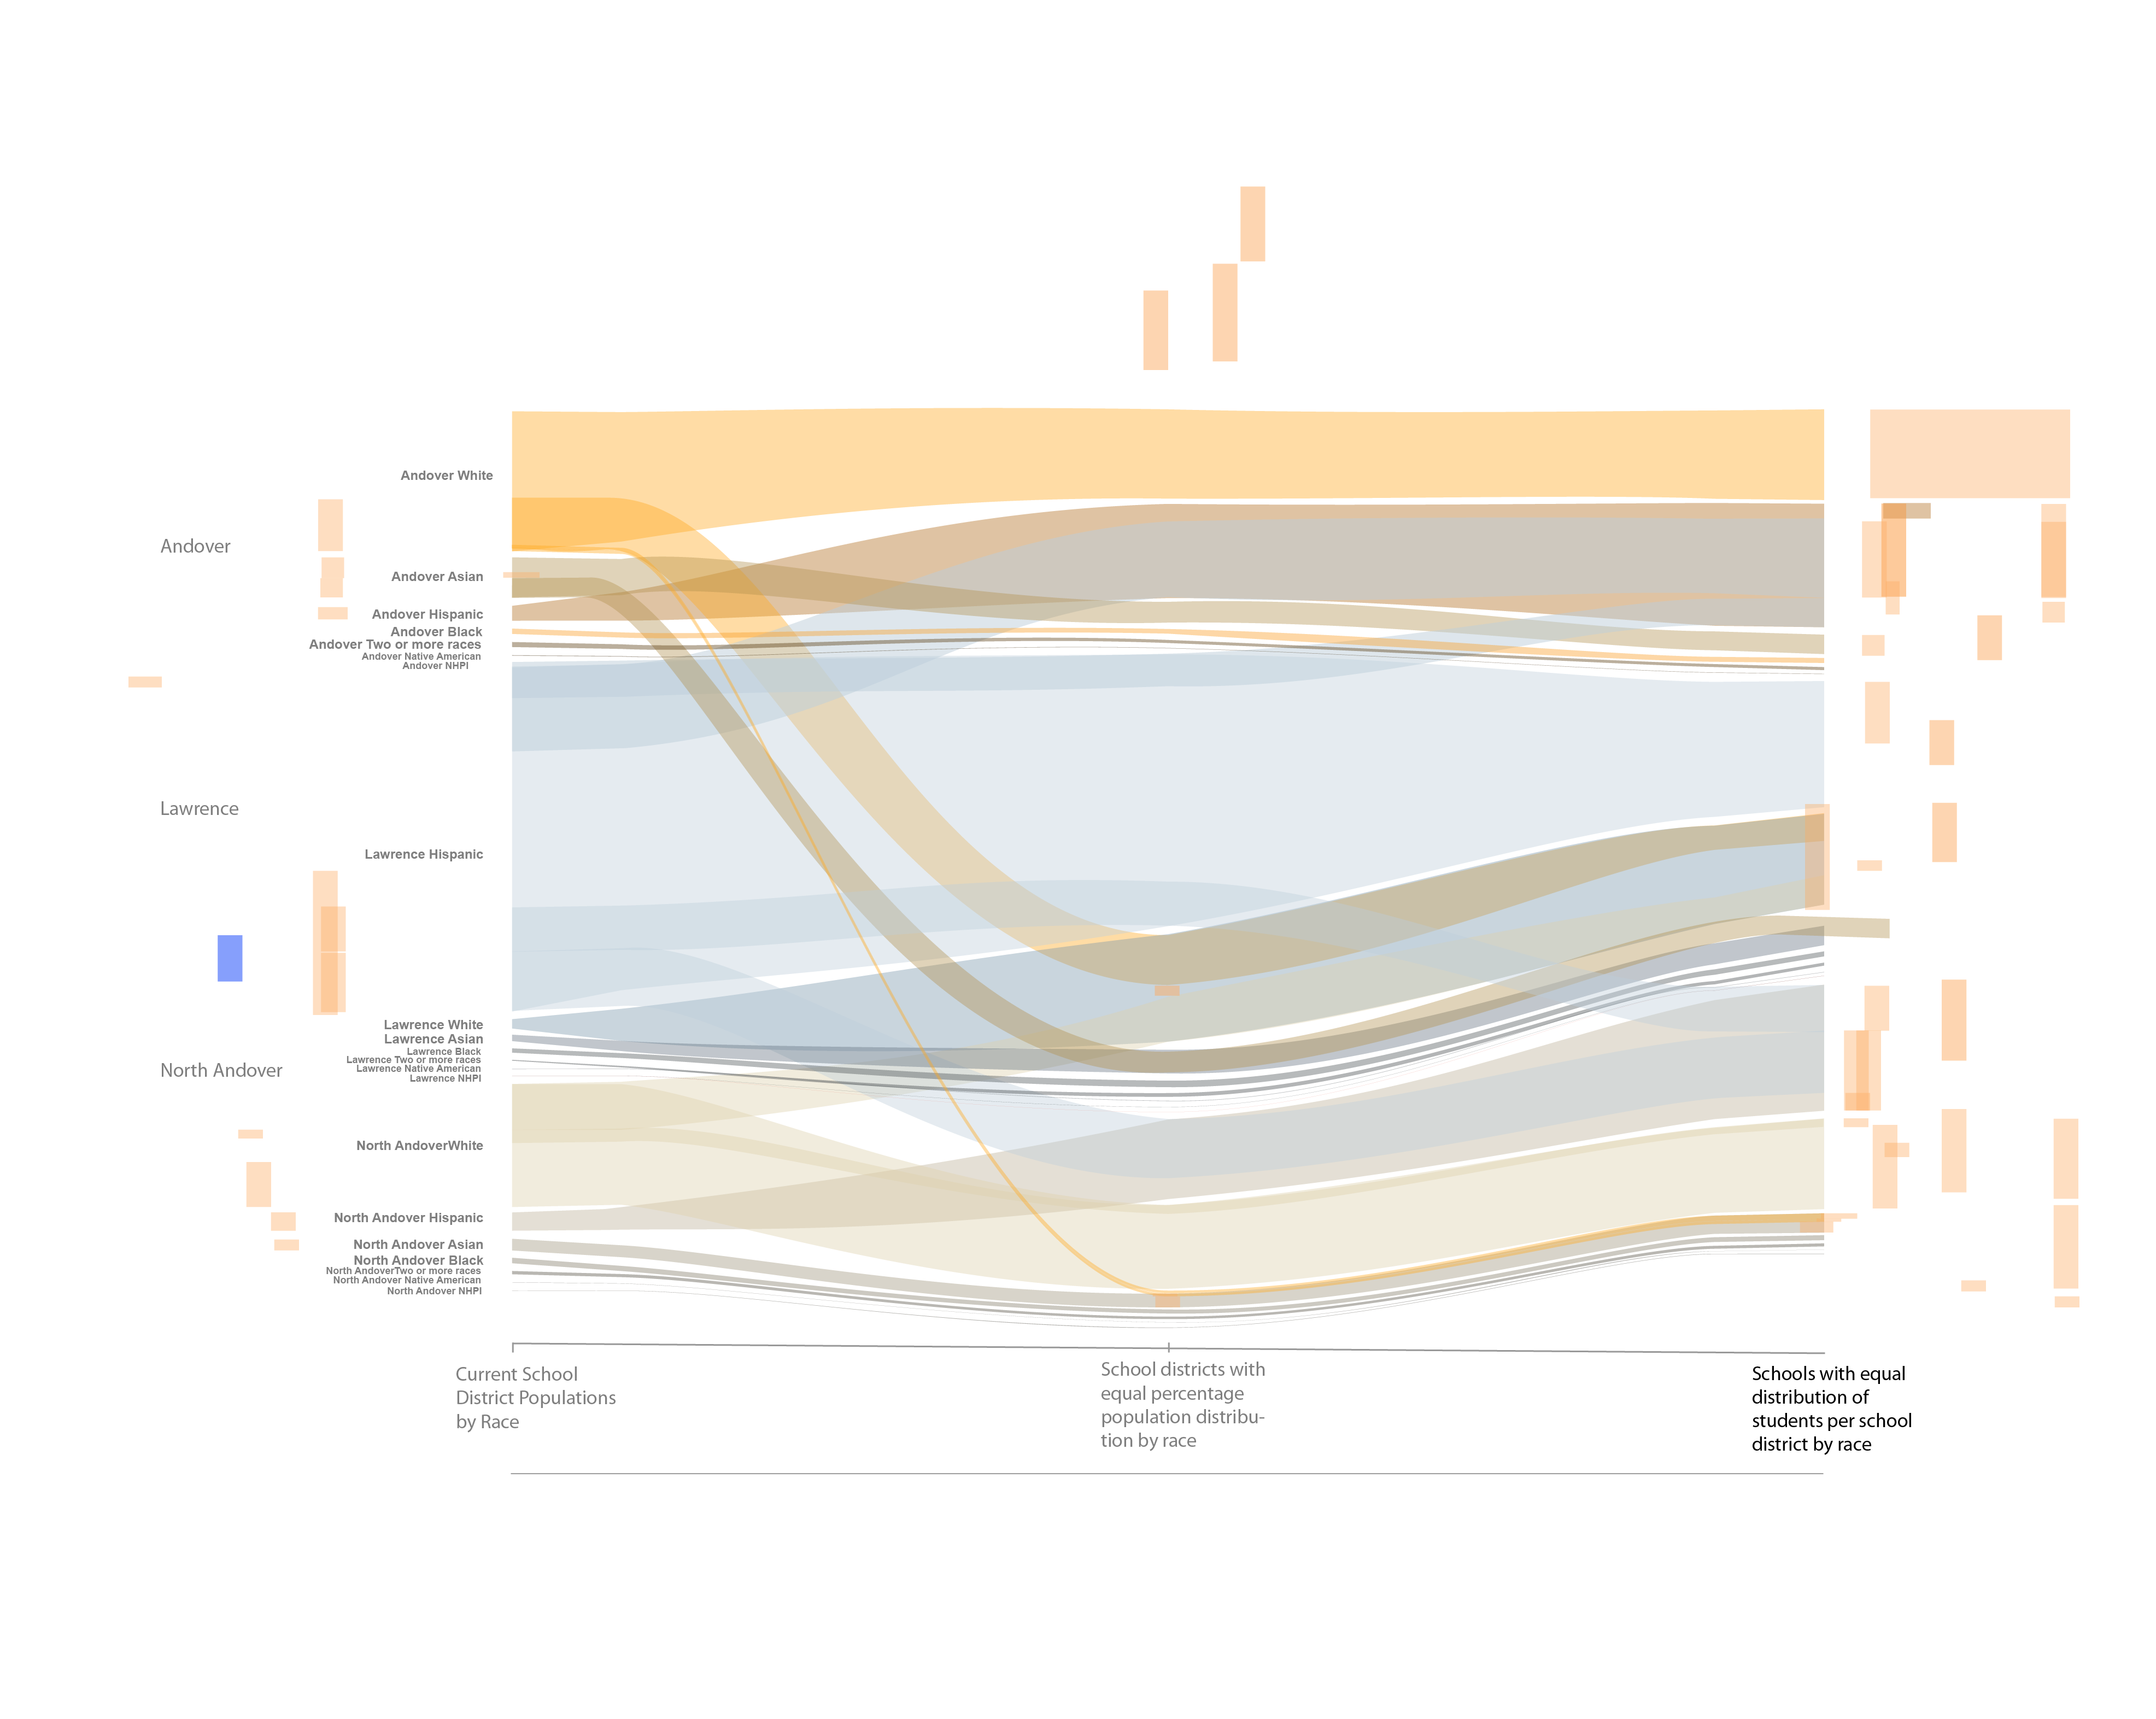
While Lawrence, Andover, and North Andover were never towns included in Boston's busing plan, the school districts today nonetheless share similar racial contrasts as Boston and neighboring communities experienced in 1975. As an exercise, I applied Boston's 1975 standard for "racial balance" to the three school districts to imagine what a racially balanced school population might look like.
Forgiving the 5 percent leeway, quick calculations yield striking results for the towns of Andover, Lawrence, and North Andover. If the total school population size remains the same but the racial balance is altered, the changes would be drastic for these three towns. Lawrence High would gain 1,082 white students from the other two schools, 14 times the current white student population. 537 white students from North Andover High would attend Lawrence High School and there would be 555 new hispanic students at North Andover High. If the school populations were equally sized with racial balance, all three schools would become majority minority schools.
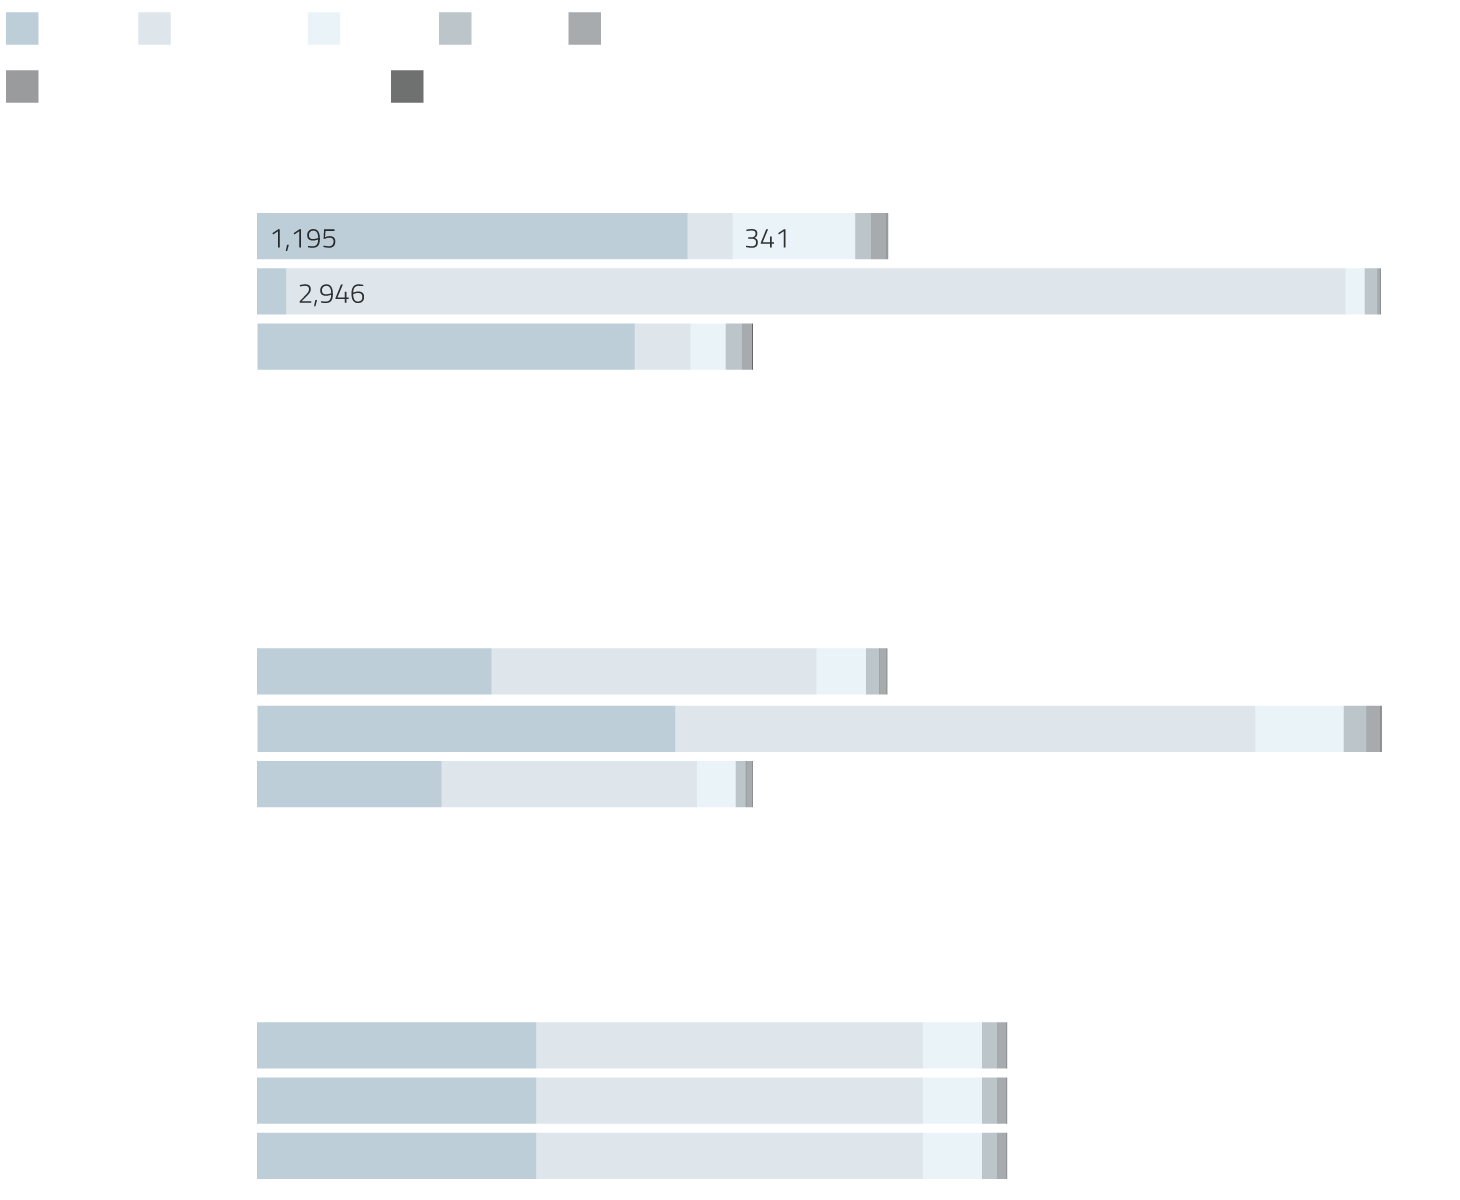
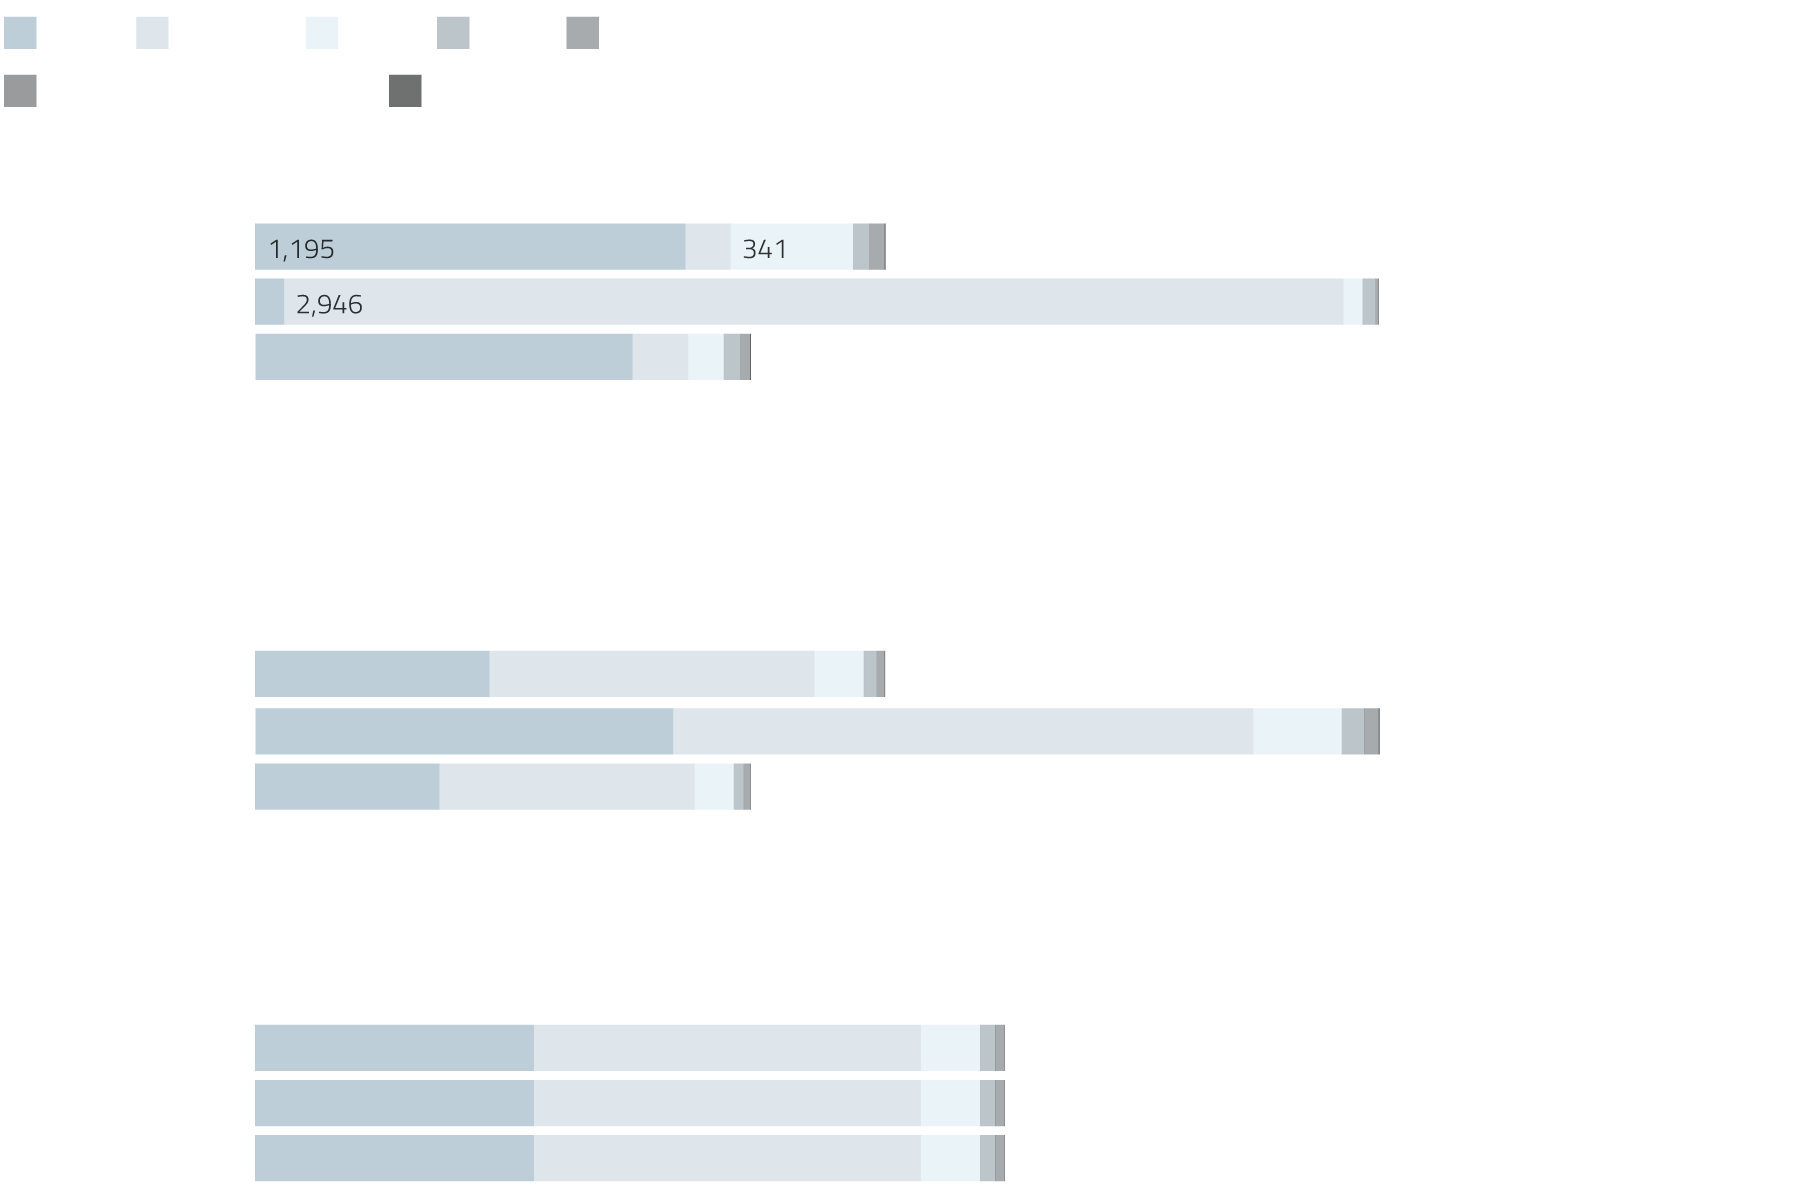
How busing could look today at Andover, Lawrence, and North Andover high schools
Applying standards set in Boston 1975 for “racial balance” in the public school system to high school populations today
White
Hispanic
Asian
Black
Two or more races
American Indian / Alaska Native
Native Hawaiian / Pacific Islander
Current High School Student Population
Andover
1,195
341
Lawrence
2,946
North Andover
1,048
Busing Scenario 1
The total student population is distributed according to the current size of the school to achieve “racial balance.” For example, white students represent 37 percent of the total student population for the three schools. Lawrence High School in this scenario would have 1,161 white students (37%) of the total 3,126 school population, gaining 1,082 white students from the other two schools.
Andover
650
904
Lawrence
1,161
1,613
North Andover
511
710
Busing Scenario 2
The total student population is distributed equally between
the three schools to achieve “racial balance”
Andover
774
1,076
Lawrence
774
1,076
North Andover
774
1,076

White
Hispanic
Asian
Black
Two or more races
American Indian / Alaska Native
Native Hawaiian / Pacific Islander
Current High School Student Population
Andover
1,195
341
Lawrence
2,946
North Andover
1,048
Busing Scenario 1
The total student population is distributed according to the current size of the school to achieve “racial balance.” For example, white students represent 37 percent of the total student population for the three schools. Lawrence High School would have 1,161 white students (37%) of the total 3,126 school population, gaining 1,082 white students from the other two schools.
Andover
650
904
Lawrence
1,161
1,613
North Andover
511
710
Busing Scenario 2
The total student population is distributed equally between the three schools to achieve “racial balance”
Andover
774
1,076
Lawrence
774
1,076
North Andover
774
1,076
Source: National Center for Education Statistics (NCES), Commission on Civil Rights in Boston, Massachusetts 1975
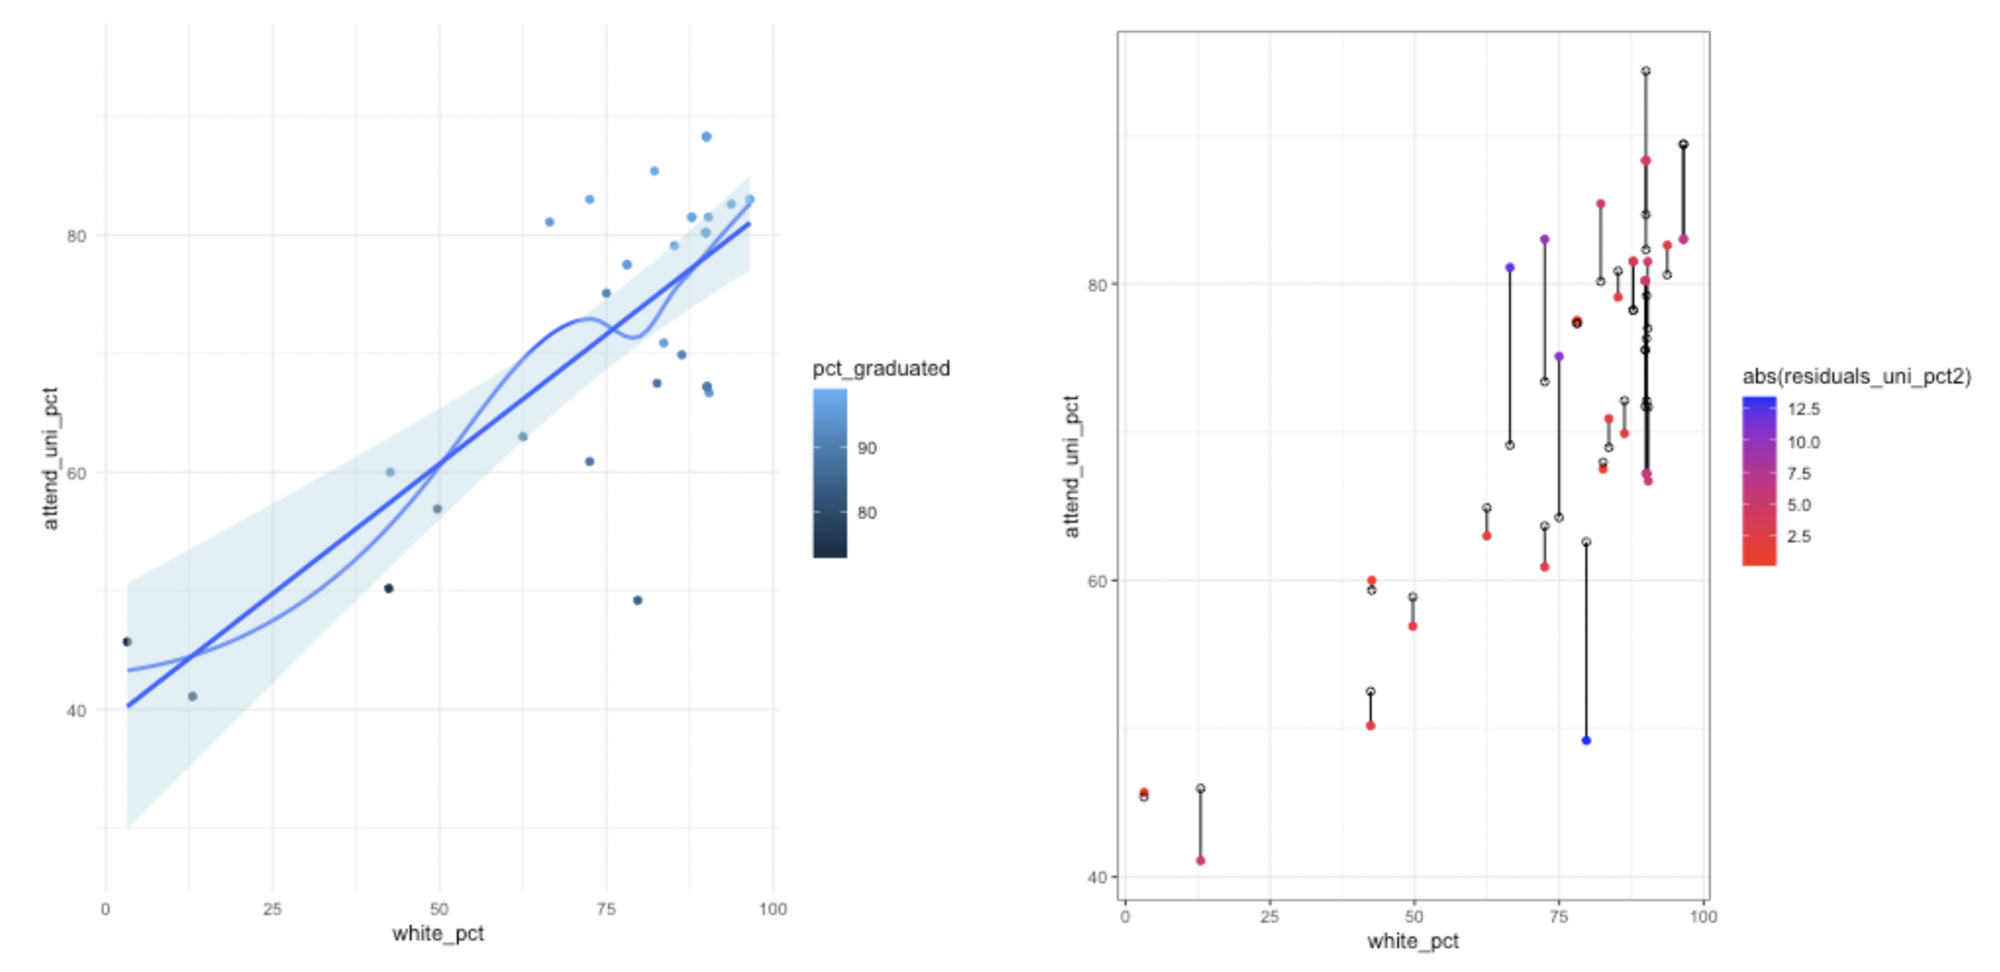
Next Steps: Regression Analysis
I have just begun to use linear regressions to consider how variables such as income and race correlate with measurements of educational attainment. Some of my prelimary findings indicate that a school's percentage of white students is more highly correlated than income or test scores with graduation and university attendance rates.
Here's my scratchpad for some of the analysis.
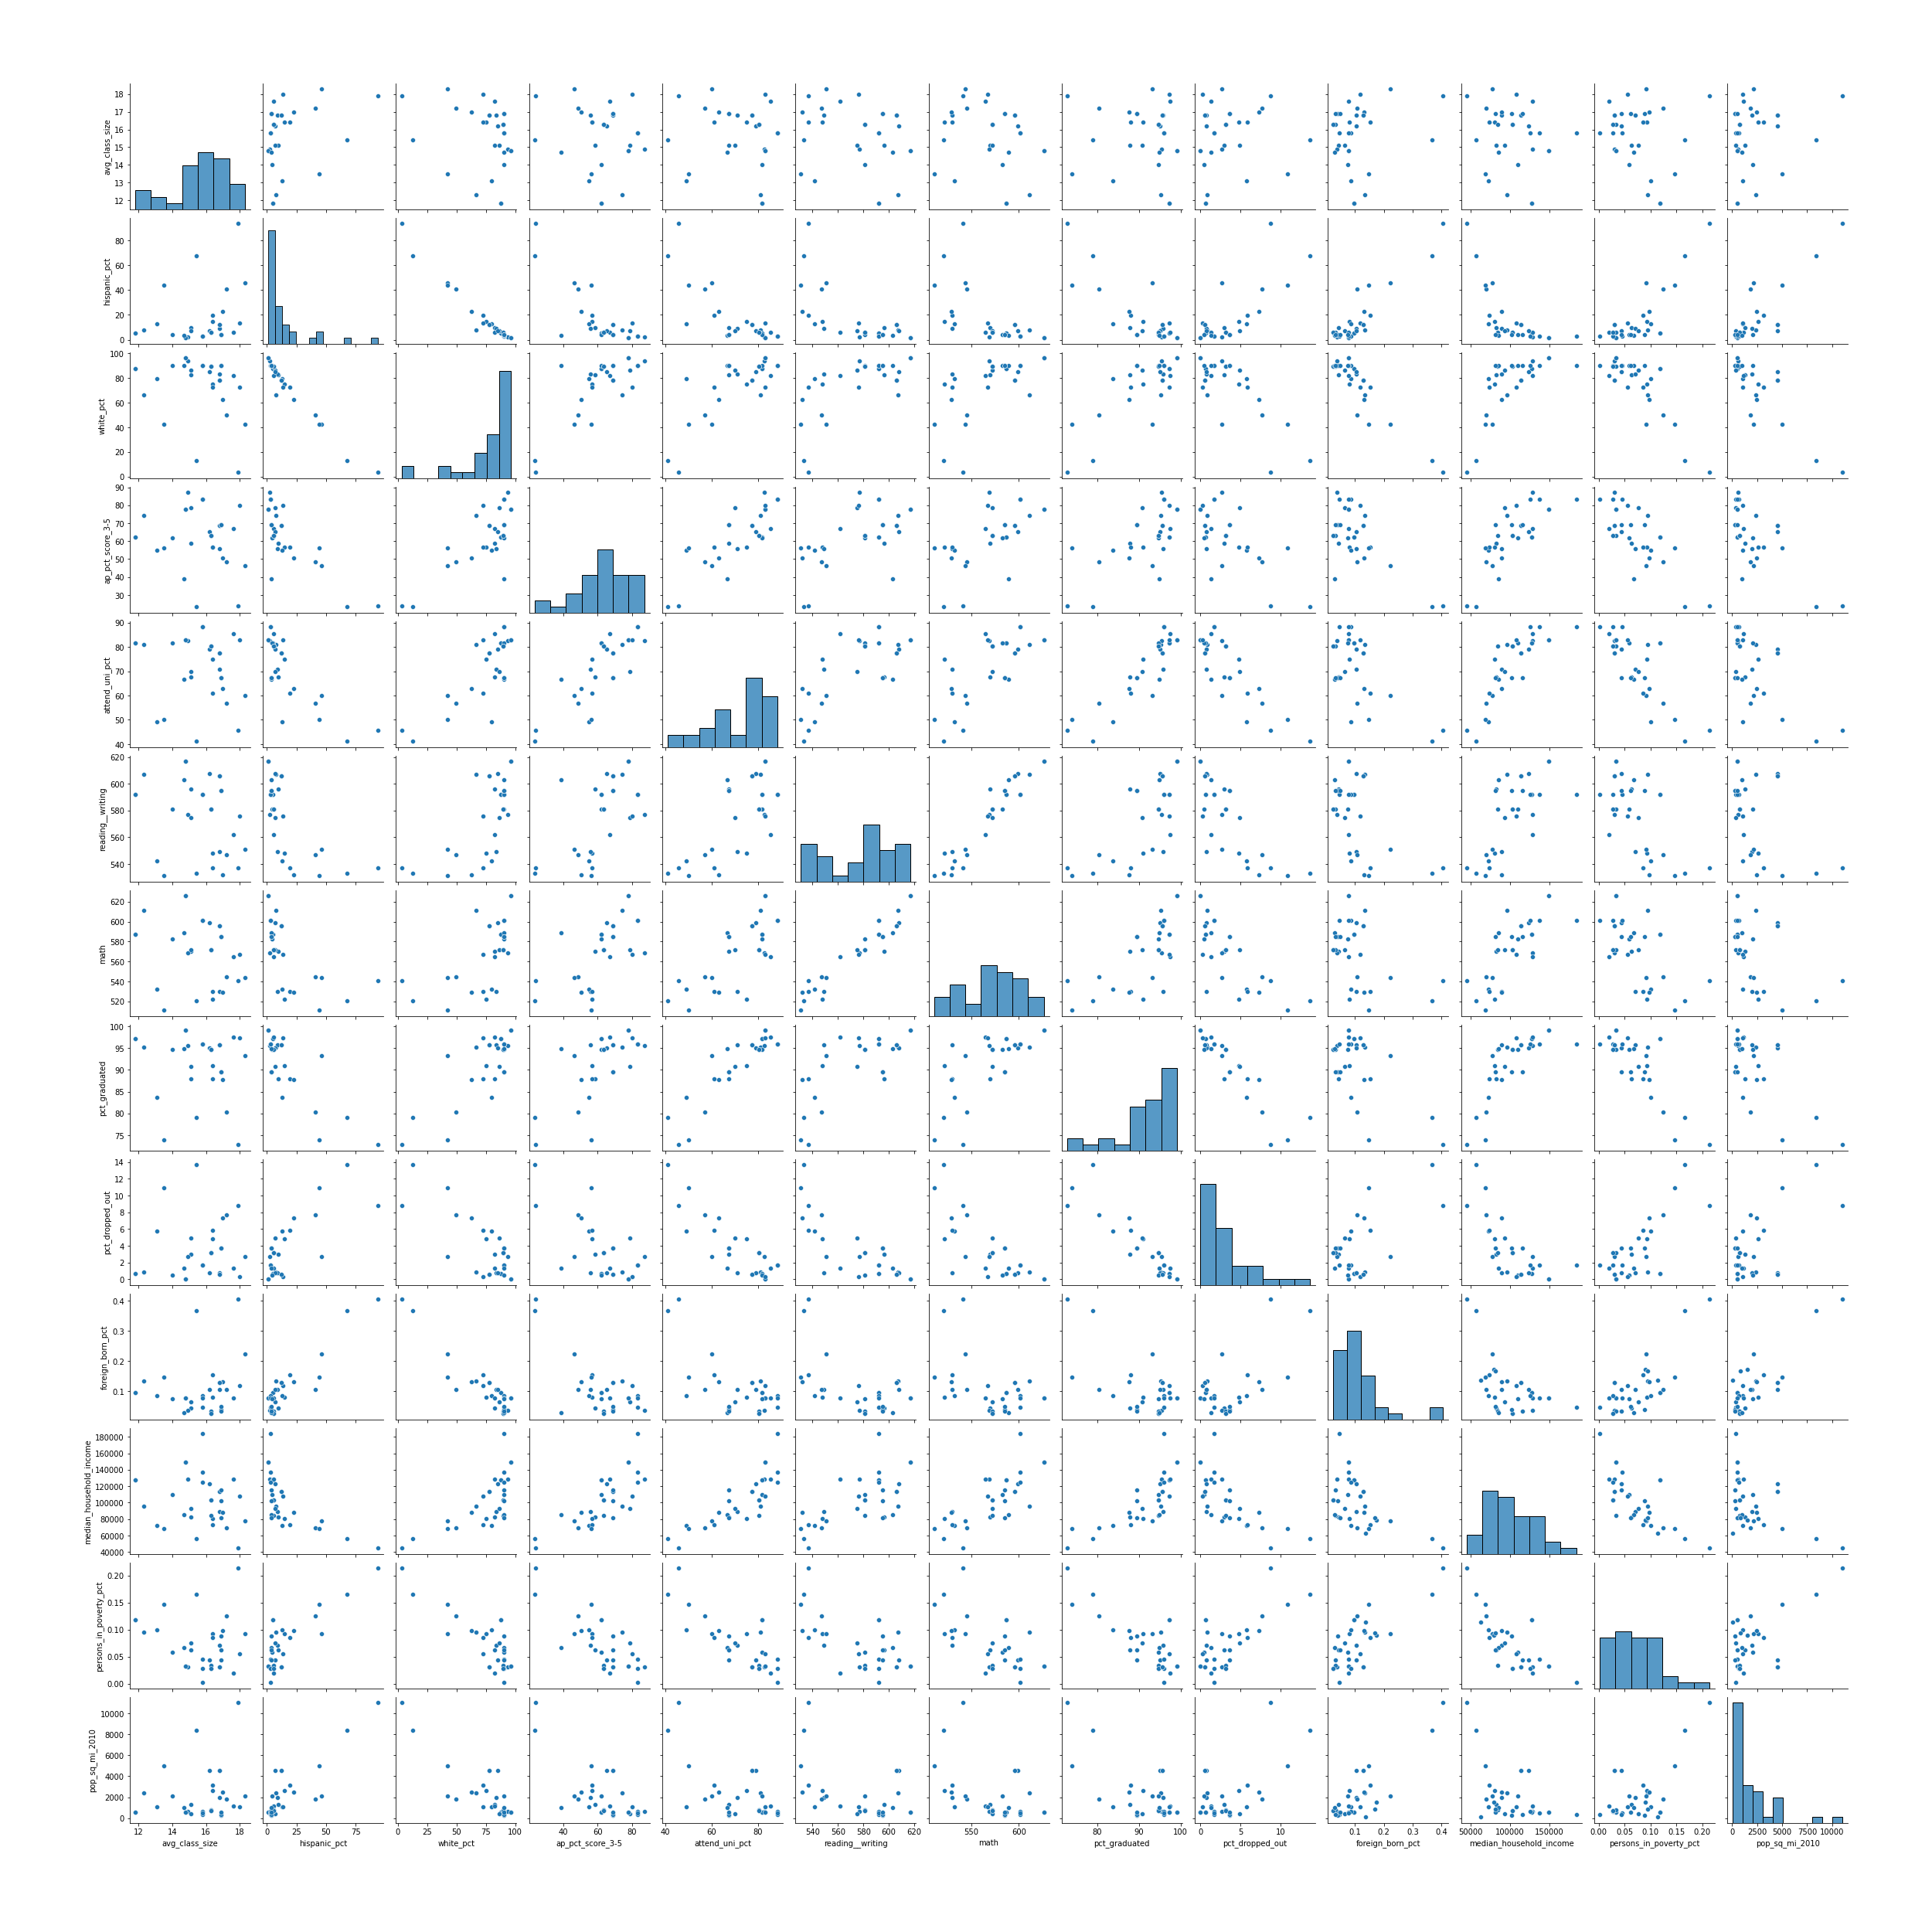
More Process
This project is still ongoing, but here is some additional process work from the first two weeks working with ggplot, plotnine, and RAWGraphs.